Note
Go to the end to download the full example code.
Glacier outlines: Randolph Glacier Inventory 7.0 and 6.0#
The Randolph Glacier Inventory (RGI) is the global inventory of glacier
outlines outside the ice sheets. esd.boundaries.glaciers.load reads either
version:
version="7.0"(default; RGI 7.0 Consortium 2023) — outlines targeted at the year 2000, as glaciers (product="glaciers") or glacier complexes (product="complexes", contiguous ice as one polygon);version="6.0"(RGI Consortium 2017) — the inventory most work up to 2023 used (OGGM and many mass-balance products), kept for comparison with it.
Both are distributed per first-order region. The loader finds the regions the
AOI touches, fetches each regional zip once into the cache, and reads the AOI.
NSIDC (source="nsidc", the default) needs an Earthdata Login;
source="oggm-mirror" is OGGM’s credential-free mirror of the original
GLIMS files, for 6.0 only. The first columns are the same for both versions:
rgi_id, name, area_km2 and o1region.
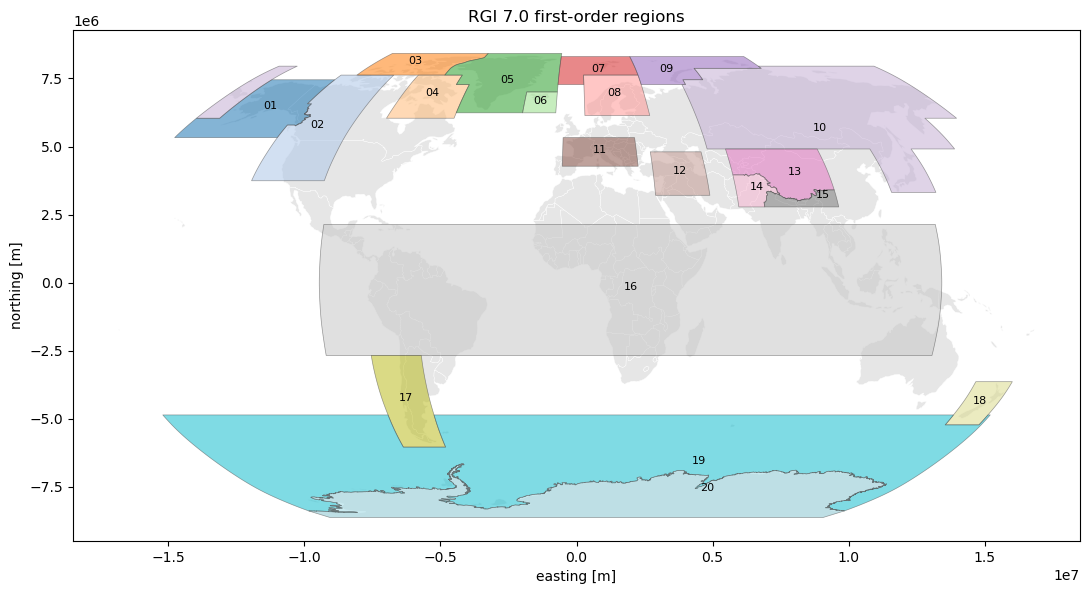
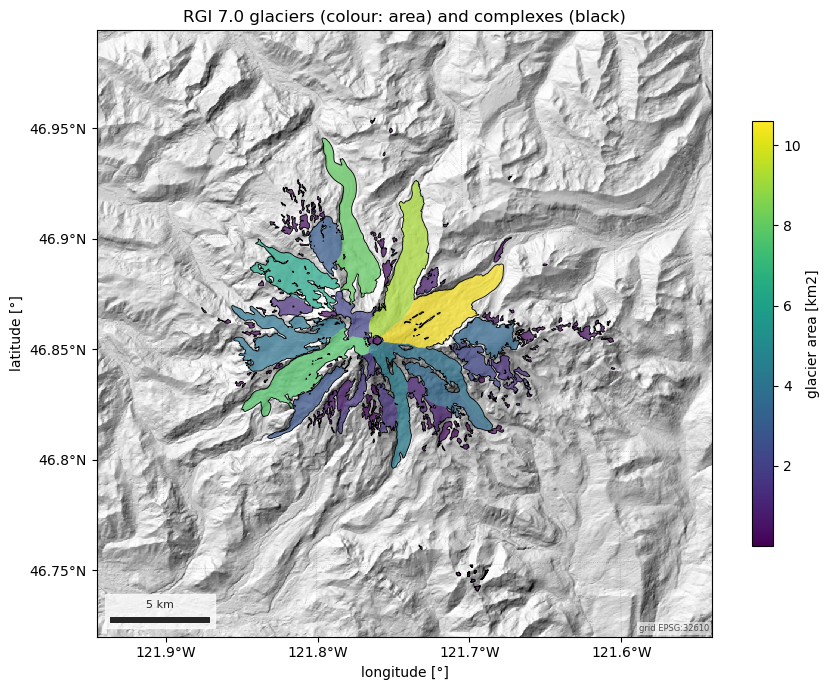
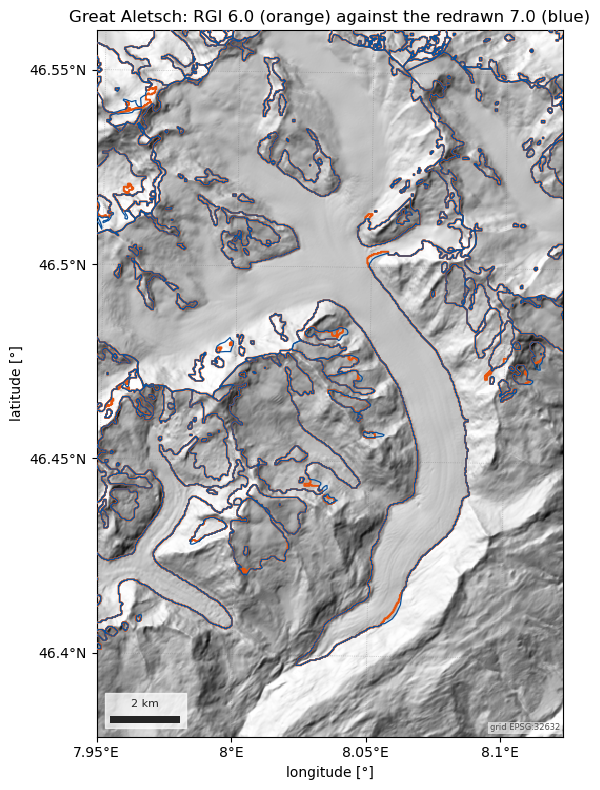
The figures show the 19 regions, Mount Rainier’s glaciers over a hillshade of the 30 m Copernicus DEM, and the Great Aletsch Glacier, where 7.0 redrew the 6.0 outlines; the text compares the versions and the Natural Earth map layer.
from matplotlib.colors import LightSource

import easysnowdata as esd

aoi = (-121.94, 46.72, -121.54, 46.99)  # Mount Rainier, WA

box = esd.parse_aoi(aoi)
utm = box.utm_crs
print(box)

for src in esd.catalog.get("rgi-glaciers").sources:
    print(f"{src.id:12} {src.title:28} {', '.join(src.requires) or 'no account'}")
AOI(bounds=(-121.9400, 46.7200, -121.5400, 46.9900), clip=True)
nsidc        NSIDC (Earthdata Login)      earthdata
oggm-mirror  OGGM mirror of GLIMS (6.0)   no account
The first-order regions, from RGI 7.0’s region file. regions(aoi) is how
the loader decides which regional archives an AOI needs; Rainier sits in
region 2, Western Canada and USA. (Region 20, the Antarctic mainland, has an
outline but no glacier file.)
regions_gdf = esd.boundaries.glaciers.regions()
print(esd.boundaries.glaciers.regions(aoi)[["o1region", "name"]].to_string(index=False))

robinson = "ESRI:54030"
world_gdf = esd.boundaries.admin.countries()
ax = world_gdf.to_crs(robinson).plot(
    color="0.9", edgecolor="white", linewidth=0.3, figsize=(11, 6)
)
regions_gdf.to_crs(robinson).plot(
    ax=ax, column="o1region", cmap="tab20", alpha=0.55, edgecolor="0.3", linewidth=0.5
)
for _, region in (
    regions_gdf.dissolve("o1region").reset_index().to_crs(robinson).iterrows()
):
    point = region.geometry.representative_point()
    ax.annotate(
        f"{region['o1region']:02d}", (point.x, point.y), ha="center", fontsize=8
    )
esd.plotting.finish_map(ax, robinson, scalebar=False, graticule=False)
ax.set_title("RGI 7.0 first-order regions")
ax.figure.tight_layout()
o1region                   name
       2 Western Canada and USA
Rainier’s glaciers from RGI 7.0, coloured by area, with the glacier complexes outlined: where ice is continuous across a divide the complex product keeps it as one polygon.
glaciers_gdf = esd.boundaries.glaciers.load(aoi)
complexes_gdf = esd.boundaries.glaciers.load(aoi, product="complexes")
print(
    f"RGI 7.0: {len(glaciers_gdf)} glaciers, {len(complexes_gdf)} complexes, "
    f"{glaciers_gdf['area_km2'].sum():.1f} km2"
)
largest_df = glaciers_gdf.nlargest(8, "area_km2")[
    ["rgi_id", "name", "area_km2", "zmin_m", "zmax_m", "aspect_deg"]
]
print(largest_df.to_string(index=False))

grid = box.to_geobox(crs="utm", resolution=30)
dem_da = esd.terrain.dem.load(aoi, crs="utm", grid_resolution=30, chunks=None)
shade = LightSource(azdeg=315, altdeg=45).hillshade(
    dem_da.values, vert_exag=1, dx=30, dy=30
)
shade_da = dem_da.copy(data=shade)
shade_da.attrs = {"long_name": "hillshade"}

ax = esd.plotting.map(
    shade_da,
    cmap="gray",
    vmin=0,
    vmax=1,
    colorbar=False,
    figsize=(9, 7),
    title="RGI 7.0 glaciers (colour: area) and complexes (black)",
)
esd.plotting.add_outline(
    ax,
    glaciers_gdf,
    column="area_km2",
    cmap="viridis",
    alpha=0.7,
    edgecolor="none",
    legend=True,
    legend_kwds={"label": "glacier area [km2]", "shrink": 0.7},
)
esd.plotting.add_outline(ax, complexes_gdf, edgecolor="black", linewidth=0.6)
ax.figure.tight_layout()
RGI 7.0: 167 glaciers, 146 complexes, 92.7 km2
                 rgi_id                 name  area_km2    zmin_m    zmax_m  aspect_deg
RGI2000-v7.0-G-02-15375       Emmons Glacier 10.593666 1600.2026 4301.6380   57.464800
RGI2000-v7.0-G-02-15372     Winthrop Glacier  9.194764 1433.3654 4359.8540   24.683199
RGI2000-v7.0-G-02-15322       Carbon Glacier  8.003782 1068.6174 3811.4336    2.788287
RGI2000-v7.0-G-02-15466       Tahoma Glacier  7.680811 1576.1061 4367.5625  247.499283
RGI2000-v7.0-G-02-15346 North Mowich Glacier  6.192921 1510.2710 3851.5017  322.763103
RGI2000-v7.0-G-02-15434    Nisqually Glacier  4.443978 1412.7291 4356.1294  160.841110
RGI2000-v7.0-G-02-15352 South Mowich Glacier  4.035071 1447.2161 3938.6895  264.438087
RGI2000-v7.0-G-02-15475     Puyallup Glacier  4.016785 1632.3442 3150.8804  282.688057
The same box in RGI 6.0, here from the credential-free OGGM mirror (the
NSIDC copy is the same file). Around Rainier, 7.0 did not redraw anything:
every one of its outlines is a 6.0 outline (is_rgi6), and src_date
shows where they come from — USGS topographic mapping of 1959 and 1970, not
the year 2000 that 7.0 targets. 7.0 only drops nine unnamed patches of
0.01 km2, at the inventory’s size threshold. Check src_date before using
RGI outlines as a year-2000 glacier extent.
rgi6_gdf = esd.boundaries.glaciers.load(aoi, version="6.0", source="oggm-mirror")
print(
    f"RGI 6.0: {len(rgi6_gdf)} glaciers, {rgi6_gdf['area_km2'].sum():.1f} km2; "
    f"RGI 7.0: {len(glaciers_gdf)} glaciers, {glaciers_gdf['area_km2'].sum():.1f} km2"
)
print(glaciers_gdf["is_rgi6"].value_counts().to_dict())
print(glaciers_gdf["src_date"].str[:4].value_counts().to_dict())
  0%|                                              | 0.00/1.59M [00:00<?, ?B/s]
  2%|▊                                     | 32.8k/1.59M [00:00<00:08, 188kB/s]
  7%|██▌                                    | 104k/1.59M [00:00<00:03, 417kB/s]
 14%|█████▎                                 | 216k/1.59M [00:00<00:02, 531kB/s]
 24%|█████████▍                             | 384k/1.59M [00:00<00:01, 863kB/s]
 38%|██████████████▌                       | 608k/1.59M [00:00<00:00, 1.04MB/s]
 64%|███████████████████████▍             | 1.01M/1.59M [00:00<00:00, 1.78MB/s]
 97%|███████████████████████████████████▊ | 1.54M/1.59M [00:01<00:00, 2.26MB/s]
  0%|                                              | 0.00/1.59M [00:00<?, ?B/s]
100%|█████████████████████████████████████| 1.59M/1.59M [00:00<00:00, 10.4GB/s]

  0%|                                              | 0.00/20.9M [00:00<?, ?B/s]
  0%|                                      | 32.8k/20.9M [00:00<01:57, 177kB/s]
  1%|▎                                      | 144k/20.9M [00:00<00:48, 426kB/s]
  1%|▌                                      | 312k/20.9M [00:00<00:32, 644kB/s]
  3%|█                                      | 577k/20.9M [00:00<00:21, 950kB/s]
  5%|█▊                                   | 1.02M/20.9M [00:00<00:13, 1.46MB/s]
  9%|███▏                                 | 1.81M/20.9M [00:01<00:07, 2.41MB/s]
 15%|█████▍                               | 3.08M/20.9M [00:01<00:03, 4.54MB/s]
 21%|███████▊                             | 4.44M/20.9M [00:01<00:02, 6.60MB/s]
 32%|███████████▉                         | 6.74M/20.9M [00:01<00:01, 10.6MB/s]
 43%|███████████████▋                     | 8.90M/20.9M [00:01<00:00, 13.5MB/s]
 60%|██████████████████████               | 12.5M/20.9M [00:01<00:00, 19.6MB/s]
 72%|██████████████████████████▊          | 15.1M/20.9M [00:01<00:00, 21.5MB/s]
 87%|████████████████████████████████▎    | 18.3M/20.9M [00:01<00:00, 24.3MB/s]
  0%|                                              | 0.00/20.9M [00:00<?, ?B/s]
100%|██████████████████████████████████████| 20.9M/20.9M [00:00<00:00, 112GB/s]
RGI 6.0: 176 glaciers, 92.7 km2; RGI 7.0: 167 glaciers, 92.7 km2
{1: 167}
{'1970': 160, '1959': 7}
Where 7.0 did redraw, the outlines change. Around the Great Aletsch Glacier (RGI region 11) every 7.0 outline is new, from 2003 imagery. The totals agree to within a few tenths of a percent, but the edges shift, most visibly around the small cirque glaciers and nunataks.
aletsch = (7.95, 46.38, 8.12, 46.56)
aletsch7_gdf = esd.boundaries.glaciers.load(aletsch)
aletsch6_gdf = esd.boundaries.glaciers.load(
    aletsch, version="6.0", source="oggm-mirror"
)
print(
    f"Aletsch box: 6.0 {len(aletsch6_gdf)} glaciers, "
    f"{aletsch6_gdf['area_km2'].sum():.1f} km2; 7.0 {len(aletsch7_gdf)} glaciers, "
    f"{aletsch7_gdf['area_km2'].sum():.1f} km2; "
    f"new outlines in 7.0: {int((aletsch7_gdf['is_rgi6'] == 0).sum())}"
)

aletsch_box = esd.parse_aoi(aletsch)
aletsch_utm = aletsch_box.utm_crs
aletsch_dem_da = esd.terrain.dem.load(
    aletsch, crs="utm", grid_resolution=30, chunks=None
)
aletsch_shade_da = aletsch_dem_da.copy(
    data=LightSource(azdeg=315, altdeg=45).hillshade(
        aletsch_dem_da.values, vert_exag=1, dx=30, dy=30
    )
)
aletsch_shade_da.attrs = {"long_name": "hillshade"}
ax = esd.plotting.map(
    aletsch_shade_da,
    cmap="gray",
    vmin=0,
    vmax=1,
    colorbar=False,
    figsize=(8, 8),
    title="Great Aletsch: RGI 6.0 (orange) against the redrawn 7.0 (blue)",
)
esd.plotting.add_outline(ax, aletsch6_gdf, edgecolor="#e6550d", linewidth=1.4)
esd.plotting.add_outline(ax, aletsch7_gdf, edgecolor="#08519c", linewidth=0.9)
ax.figure.tight_layout()
  0%|                                              | 0.00/5.84M [00:00<?, ?B/s]
  1%|▏                                     | 32.8k/5.84M [00:00<00:32, 177kB/s]
  2%|▉                                      | 136k/5.84M [00:00<00:14, 399kB/s]
  6%|██▏                                    | 336k/5.84M [00:00<00:07, 704kB/s]
 12%|████▍                                 | 673k/5.84M [00:00<00:04, 1.14MB/s]
 21%|███████▊                             | 1.23M/5.84M [00:00<00:02, 1.81MB/s]
 34%|████████████▋                        | 2.00M/5.84M [00:01<00:01, 3.09MB/s]
 47%|█████████████████▍                   | 2.75M/5.84M [00:01<00:00, 3.47MB/s]
 61%|██████████████████████▋              | 3.59M/5.84M [00:01<00:00, 4.55MB/s]
 90%|█████████████████████████████████▎   | 5.25M/5.84M [00:01<00:00, 7.45MB/s]
  0%|                                              | 0.00/5.84M [00:00<?, ?B/s]
100%|█████████████████████████████████████| 5.84M/5.84M [00:00<00:00, 27.7GB/s]
Aletsch box: 6.0 86 glaciers, 218.8 km2; 7.0 86 glaciers, 218.4 km2; new outlines in 7.0: 86
Natural Earth’s glaciated_areas layer is a map layer, generalized for
1:10m: around Rainier it is one blob, larger than the glaciers it stands for.
Use it for small-scale maps and the RGI for anything measured.
ice_gdf = esd.boundaries.natural_earth.load(aoi, layer="glaciated_areas")
rainier_ice_gdf = ice_gdf.clip(box.geometry)
print(
    f"Natural Earth 1:10m glaciated area in the box: "
    f"{rainier_ice_gdf.to_crs(utm).area.sum() / 1e6:.1f} km2, against "
    f"{glaciers_gdf.clip(box.geometry).to_crs(utm).area.sum() / 1e6:.1f} km2 in RGI 7.0"
)
  0%|                                              | 0.00/1.64M [00:00<?, ?B/s]
  0%|                                              | 0.00/1.64M [00:00<?, ?B/s]
100%|█████████████████████████████████████| 1.64M/1.64M [00:00<00:00, 11.7GB/s]
Natural Earth 1:10m glaciated area in the box: 171.8 km2, against 92.6 km2 in RGI 7.0
Total running time of the script: (0 minutes 19.595 seconds)