Note
Go to the end to download the full example code.
Russian route snow surveys (RIHMI-WDC)#
Russia’s weather stations survey snow along 1–2 km routes in the field and in forest every 10 days through the cold season (every 5 days during melt), measuring depth, density and SWE: the largest SWE record in Eurasia. The Russian Research Institute of Hydrometeorological Information (RIHMI-WDC) holds it from 1966 to the present, but its own portal (AISORI-M) needs a free login and has no API. The open copy is NSIDC’s G01170 mirror, 1966–1996, about 1,350 stations.
RIHMIClient reads the NSIDC mirror with no account. With a free AISORI-M
account it also exports recent surveys and daily snow cover from the portal
itself (source="aisori"; see the next example), or reads zips exported by
hand (data_dir=). Every survey
record is "periodic" and says which route it came from (route_type).
It is not part of esd.stations.inventory() or load().
The figures show the stations in the public mirror, and the field and forest SWE at Yakutsk through the 1980s.
import geopandas as gpd
import matplotlib.pyplot as plt
import pandas as pd

import easysnowdata as esd
from easysnowdata.stations.clients import RIHMIClient

client = RIHMIClient()
Stations in the public mirror, coloured by whether RIHMI still lists them in its current route-survey catalogue (data after 1996 needs an AISORI-M login).
stations = [s for s in client.get_all_stations() if s["in_nsidc_g01170"]]
stations_gdf = gpd.GeoDataFrame(
    pd.DataFrame(stations).set_index("station_id"),
    geometry=gpd.points_from_xy(
        [s["longitude"] for s in stations], [s["latitude"] for s in stations]
    ),
    crs="EPSG:4326",
)
stations_gdf["catalogue"] = stations_gdf["in_route_survey_catalogue"].map(
    {True: "still surveyed (login for data after 1996)", False: "public mirror only"}
)
print(stations_gdf["catalogue"].value_counts().to_string())

ax = esd.plotting.points(
    stations_gdf.cx[15:180, :],
    column="catalogue",
    legend_label="RIHMI route surveys",
    title="Route snow surveys in NSIDC G01170",
    markersize=3,
    figsize=(12, 6),
)
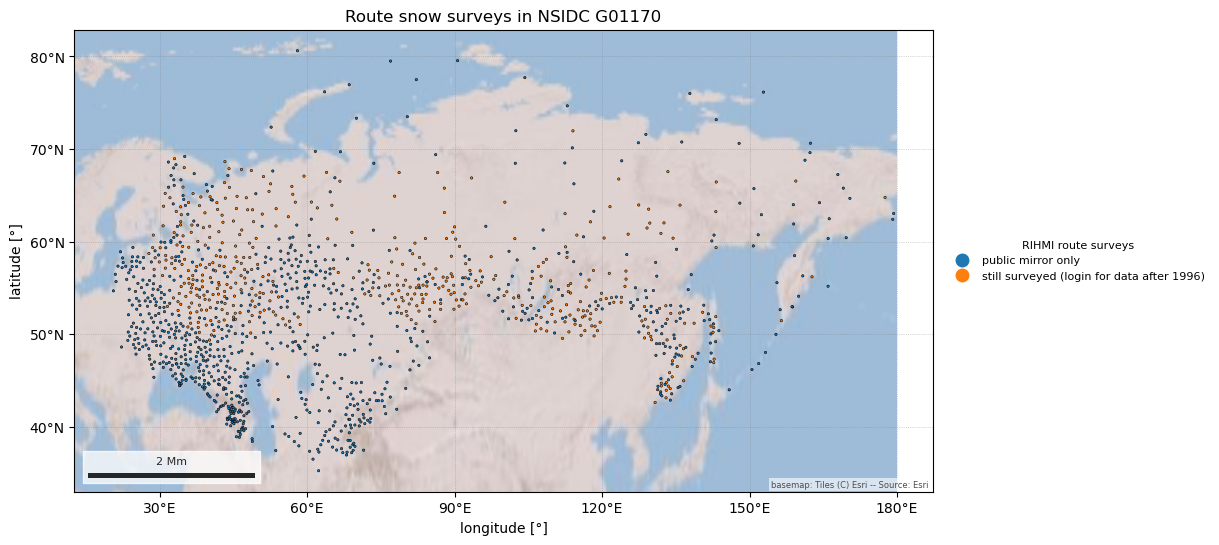
catalogue
public mirror only                            896
still surveyed (login for data after 1996)    449
/home/runner/work/easysnowdata/easysnowdata/docs/gallery/station_datasets/plot_rihmi.py:49: GeographicAxesWarning: The data are in a geographic CRS (EPSG:4326), so one axis unit is a degree, not a metre. The axes use a latitude-corrected aspect (1/cos(58.0°) = 1.88) so shapes are not stretched; for a true equal-area grid load the product with crs='utm'.
  ax = esd.plotting.points(
Field and forest routes at Yakutsk (WMO 24959), 1980–1990. Forest routes hold more snow: less wind, less sublimation.
records = client.get_data(
    "24959", variables="swe", begin_date="1980-07-01", end_date="1990-06-30"
)
swe_df = pd.DataFrame(records).assign(date=lambda df: pd.to_datetime(df["date"]))
print(swe_df.groupby("route_type").size().to_string())
fig, ax = plt.subplots(figsize=(10, 4))
for route, group in swe_df.groupby("route_type"):
    ax.plot(group["date"], group["value"], ".", label=f"{route} route")
ax.set(ylabel="SWE (cm)", title="Route-survey SWE at Yakutsk")
ax.legend()
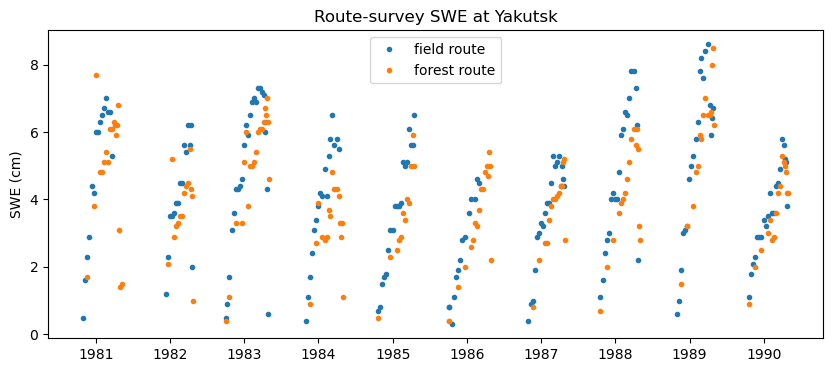
route_type
field     210
forest    180

<matplotlib.legend.Legend object at 0x7fba6ff334d0>