Note
Go to the end to download the full example code.
Recent Russian snow surveys and snow cover (RIHMI АИСОРИ-М)#
The public NSIDC mirror of the Russian route snow surveys stops in 1996. RIHMI-WDC’s own portal, Web АИСОРИ-М, holds the record from 1966 to the present, and the daily snow depth measured on each station’s stake as well. It needs a free account (http://aisori-m.meteo.ru/waisori/registration.xhtml) and has no API.
With AISORI_USERNAME and AISORI_PASSWORD set (the aisori auth
provider), RIHMIClient.get_data(..., source="aisori") logs in, fills in
the portal’s export form for the stations and years asked for, and reads the
zip it returns. Each export is cached, so asking again is instant. Route
surveys are interval="periodic" and daily snow cover is
interval="daily". Not every catalogue station is offered by the portal
(68 of the 517 route-survey stations in October 2026); the ones that are not
are skipped with a warning.
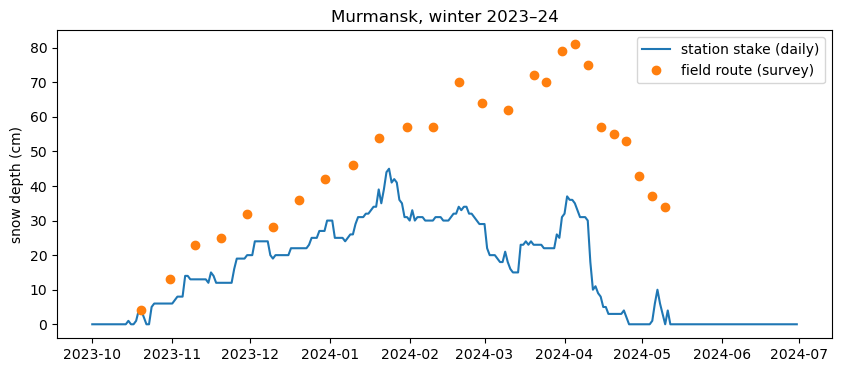
The figures show ten winters of route-survey SWE at Murmansk and Yakutsk, and one winter of daily stake depth at Murmansk next to its route surveys.
import matplotlib.pyplot as plt
import pandas as pd

import easysnowdata as esd
from easysnowdata.stations.clients import RIHMIClient

print(esd.auth.status().loc[["aisori"], ["configured", "how"]])

client = RIHMIClient(use_nsidc=False)
stations = {"22113": "Murmansk", "24959": "Yakutsk"}
          configured                                  how
provider
aisori          True  env:AISORI_USERNAME/AISORI_PASSWORD
Route-survey SWE and mean route depth (the default variables), water years 2015–2024, from one АИСОРИ-М export. Every record names its route: in these years Murmansk reports a field route and Yakutsk a forest route.
records = client.get_data(
    list(stations),
    begin_date="2014-10-01",
    end_date="2024-09-30",
    source="aisori",
)
survey_df = pd.DataFrame(records).assign(date=lambda df: pd.to_datetime(df["date"]))
swe_df = survey_df[survey_df["variable"] == "SWE"].assign(
    water_year=lambda df: df["date"].dt.year + (df["date"].dt.month >= 10)
)
print(swe_df.groupby(["station_id", "route_type"]).size().to_string())

fig, axes = plt.subplots(2, 1, figsize=(10, 6), sharex=True)
for ax, (sid, name) in zip(axes, stations.items()):
    site_df = swe_df[swe_df["station_id"] == sid]
    # one line per water year, so summers are gaps rather than joined points
    for _, winter in site_df.groupby("water_year"):
        ax.plot(winter["date"], winter["value"], ".-", color="C0", ms=3, lw=0.8)
    route = "/".join(site_df["route_type"].unique())
    ax.set(ylabel="SWE (cm)", title=f"{name} ({sid}), {route} route")
fig.suptitle("Route-survey SWE from АИСОРИ-М")
fig.tight_layout()
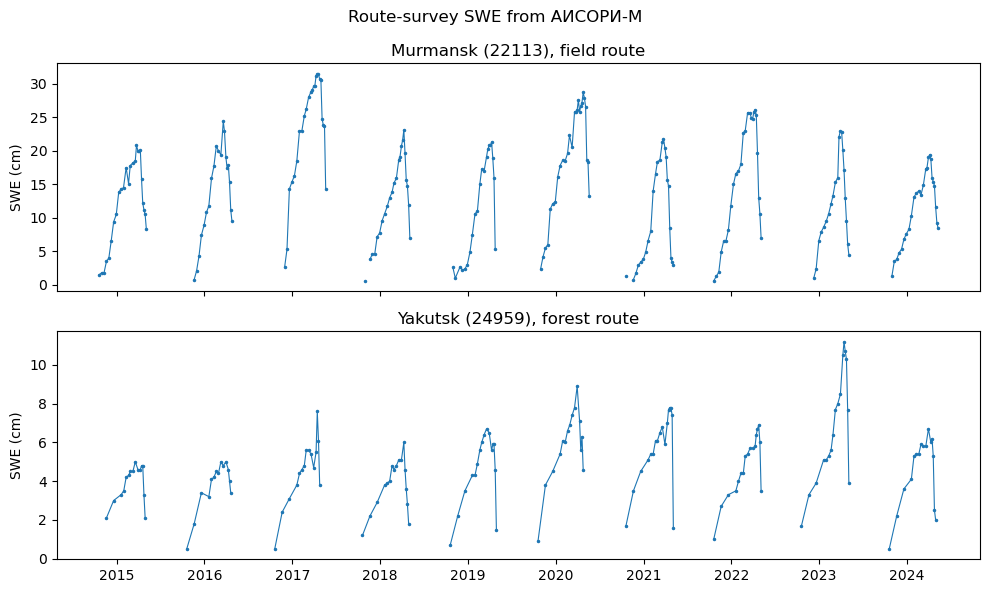
station_id  route_type
22113       field         248
24959       forest        159
Daily snow depth on the Murmansk station stake (interval="daily") for
the 2023–24 winter, with the route-survey depth of the same winter (from
the export above, so only the daily data are a new export).
daily_df = pd.DataFrame(
    client.get_data(
        "22113",
        interval="daily",
        begin_date="2023-10-01",
        end_date="2024-06-30",
        source="aisori",
    )
).assign(date=lambda df: pd.to_datetime(df["date"]))
route_df = survey_df[
    (survey_df["station_id"] == "22113")
    & (survey_df["variable"] == "HS_MEAN")
    & survey_df["date"].between("2023-10-01", "2024-06-30")
]

fig, ax = plt.subplots(figsize=(10, 4))
ax.plot(daily_df["date"], daily_df["value"], label="station stake (daily)")
for route, group in route_df.groupby("route_type"):
    ax.plot(group["date"], group["value"], "o", label=f"{route} route (survey)")
ax.set(ylabel="snow depth (cm)", title="Murmansk, winter 2023–24")
ax.legend()
<matplotlib.legend.Legend object at 0x7fba18aa7110>
Total running time of the script: (0 minutes 11.591 seconds)