Note
Go to the end to download the full example code.
Alberta snow pillows and snow courses (Alberta River Basins)#
Alberta Environment and Protected Areas runs about 20 snow pillows in the
Rockies and foothills, plus manual snow courses, and shows them, with mirrored
BC and SNOTEL pillows and many weather stations’ snow depth, on the Alberta
River Basins site. AlbertaClient reads the same station catalog and data
downloads the site’s own map uses.
Most Alberta pillows are already in AWDB (as MSNT stations), so for SWE
this client adds freshness more than coverage: values arrive within an hour,
at 15-minute resolution. The site publishes no API or licence, only a
disclaimer that the data are provisional; check with Alberta Environment
before building anything that runs on a schedule.
It is not part of esd.stations.inventory() or load().
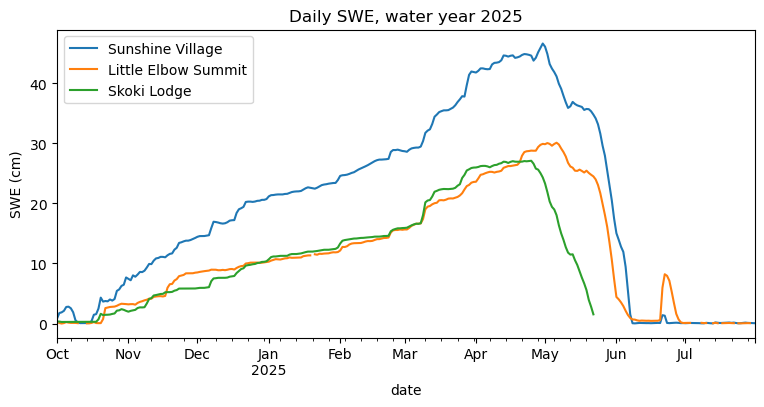
The figures show the snow stations by type, and one winter of daily SWE at three Alberta pillows.
import geopandas as gpd
import pandas as pd

import easysnowdata as esd
from easysnowdata.stations.clients import AlbertaClient

client = AlbertaClient()
Every snow station the catalog lists. operator_code separates Alberta’s
own pillows (EPA) from the mirrored BC and SNOTEL ones.
stations = client.get_all_stations()
stations_gdf = gpd.GeoDataFrame(
    pd.DataFrame(stations).set_index("station_id"),
    geometry=gpd.points_from_xy(
        [s["longitude"] for s in stations], [s["latitude"] for s in stations]
    ),
    crs="EPSG:4326",
).dropna(subset=["latitude"])
stations_gdf["kind"] = "snow depth only"
stations_gdf.loc[stations_gdf["has_survey"], "kind"] = "snow course"
stations_gdf.loc[stations_gdf["has_pillow_swe"], "kind"] = "snow pillow"
print(pd.crosstab(stations_gdf["kind"], stations_gdf["status"]).to_string())

ax = esd.plotting.points(
    stations_gdf,
    column="kind",
    legend_label="station kind",
    title="Alberta River Basins snow stations",
)
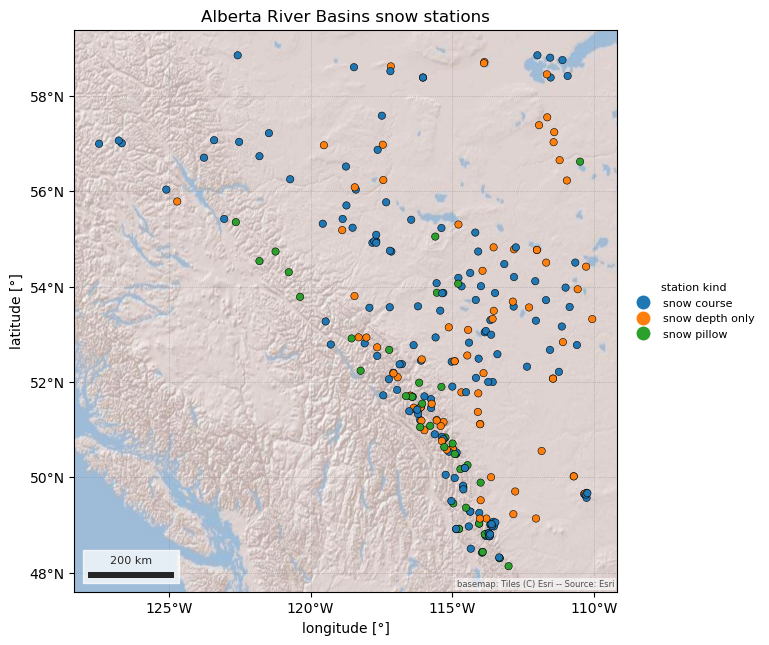
status           Active  Inactive
kind
snow course         116        41
snow depth only      21        57
snow pillow          34         4
/home/runner/work/easysnowdata/easysnowdata/docs/gallery/station_datasets/plot_alberta.py:47: GeographicAxesWarning: The data are in a geographic CRS (EPSG:4326), so one axis unit is a degree, not a metre. The axes use a latitude-corrected aspect (1/cos(53.5°) = 1.68) so shapes are not stretched; for a true equal-area grid load the product with crs='utm'.
  ax = esd.plotting.points(
One winter of daily SWE at three Alberta pillows. "daily" uses the
site’s own daily mean; "hourly" and "sub_hourly" return the native
readings with Mountain Standard Time timestamps.
pillows = ["05BB803", "05BJ805", "05CA805"]
records = client.get_data(
    pillows, variables="swe", begin_date="2024-10-01", end_date="2025-07-31"
)
swe_df = (
    pd.DataFrame(records)
    .assign(date=lambda df: pd.to_datetime(df["date"]))
    .pivot_table(index="date", columns="station_id", values="value")
)
swe_df.columns = [stations_gdf.loc[c, "name"] for c in swe_df.columns]
ax = swe_df.plot(figsize=(9, 4), title="Daily SWE, water year 2025")
ax.set_ylabel("SWE (cm)")
Text(24.0, 0.5, 'SWE (cm)')