Note
Go to the end to download the full example code.
GHCN-Daily snow depth worldwide (NOAA NCEI)#
The Global Historical Climatology Network – Daily is the world’s largest
archive of daily station observations, assembled by NOAA NCEI from national
weather services, the U.S. COOP and CoCoRaHS networks, ECA&D and others. About
70,000 of its stations report snow depth (SNWD) or SWE (WESD) at some
point in their record. For snow it is a snow-depth source: daily SWE that
is not already in AWDB exists at only a few dozen U.S. and Canadian sites, and
GHCN-D also mirrors SNOTEL (station ids with S as the third character).
GHCNDClient reads NCEI’s public files, with no account: the station and
inventory lists once per client, then one full-record file per station (or
get_year_data() for one bulk file per year). It is not part of
esd.stations.inventory() or load().
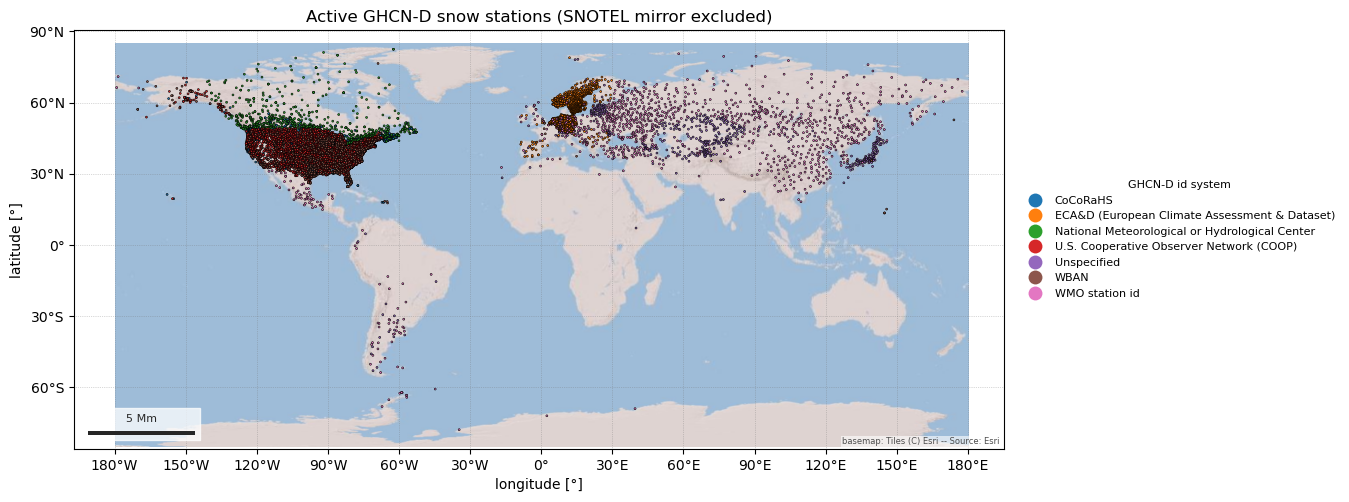
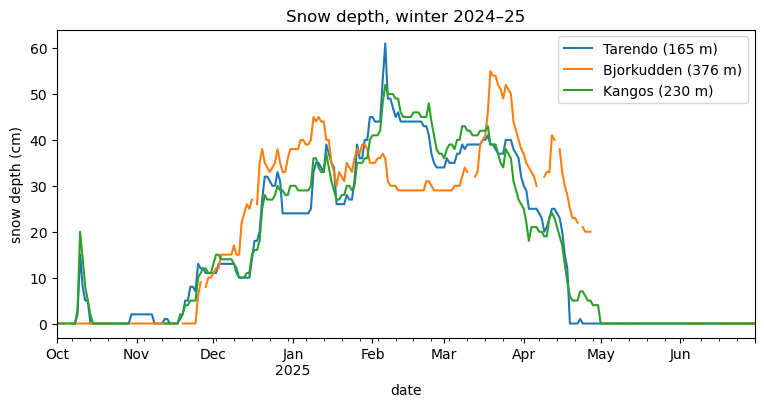
The figures show where active snow-depth stations are, and one winter of daily snow depth at three stations in the far north of Sweden.
import geopandas as gpd
import pandas as pd

import easysnowdata as esd
from easysnowdata.stations.clients import GHCNDClient

client = GHCNDClient()
Every station with snow depth or SWE, as a GeoDataFrame. ghcn_network
is the third character of the id: which numbering system (and roughly which
network) the station comes from. Dropping "S" removes the SNOTEL mirror.
stations = client.get_stations(active_only=True, exclude_networks="S")
stations_gdf = gpd.GeoDataFrame(
    pd.DataFrame(stations).set_index("station_id"),
    geometry=gpd.points_from_xy(
        [s["longitude"] for s in stations], [s["latitude"] for s in stations]
    ),
    crs="EPSG:4326",
)
print(f"{len(stations_gdf)} active snow stations outside SNOTEL")
print(stations_gdf["ghcn_network_name"].value_counts().to_string())
20113 active snow stations outside SNOTEL
ghcn_network_name
CoCoRaHS                                          10941
U.S. Cooperative Observer Network (COOP)           4655
ECA&D (European Climate Assessment & Dataset)      1427
WMO station id                                     1142
National Meteorological or Hydrological Center      774
WBAN                                                681
Unspecified                                         493
Outside North America the active stations are national weather services’ synoptic sites and ECA&D’s European stations.
ax = esd.plotting.points(
    stations_gdf,
    column="ghcn_network_name",
    legend_label="GHCN-D id system",
    title="Active GHCN-D snow stations (SNOTEL mirror excluded)",
    markersize=2,
    figsize=(12, 6),
)
/home/runner/work/easysnowdata/easysnowdata/docs/gallery/station_datasets/plot_ghcnd.py:48: GeographicAxesWarning: The data are in a geographic CRS (EPSG:4326), so one axis unit is a degree, not a metre. The axes use a latitude-corrected aspect (1/cos(2.3°) = 1.00) so shapes are not stretched; for a true equal-area grid load the product with crs='utm'.
  ax = esd.plotting.points(
One winter of daily snow depth at three Swedish stations north of the Arctic Circle. Records come back as plain dicts; a pivot gives one column per station.
records = client.get_data(
    ["SWE00140834", "SWE00140864", "SWE00140870"],
    variables="snwd",
    begin_date="2024-10-01",
    end_date="2025-06-30",
)
depth_df = (
    pd.DataFrame(records)
    .assign(date=lambda df: pd.to_datetime(df["date"]))
    .pivot_table(index="date", columns="station_id", values="value")
)
depth_df.columns = [
    f"{stations_gdf.loc[c, 'name'].title()} ({stations_gdf.loc[c, 'elevation_m']:.0f} m)"
    for c in depth_df.columns
]
ax = depth_df.plot(figsize=(9, 4), title="Snow depth, winter 2024–25")
ax.set_ylabel("snow depth (cm)")
Text(24.0, 0.5, 'snow depth (cm)')
Each value is a daily reading, but check interval and the flags before
treating a GHCN-D series as complete: values that failed NCEI’s quality
control come back as None (keep_qc_failed=True keeps them), and
some sources leave snow-free days blank rather than reporting 0 cm.
print(pd.DataFrame(records)["interval"].unique())
<ArrowStringArray>
['daily']
Length: 1, dtype: str
Total running time of the script: (0 minutes 6.525 seconds)