Note
Go to the end to download the full example code.
Norwegian snow pillows (NVE HydAPI)#
Output from the last scheduled build
This example needs nve credentials. The figures and printed output
below come from the most recent scheduled build, which has them; this build
reused that output instead of re-running the example.
NVE is the one network of the five that needs a credential: a free API key in
NVE_API_KEY. easysnowdata reads it through its nve auth provider, so a
missing key raises CredentialError with the setup steps before any request
is made, rather than an opaque HTTP 401.
Request a key at https://hydapi.nve.no/.
import matplotlib.pyplot as plt

import easysnowdata as esd
Check the credential first; everything below needs it.
print(esd.auth.status())
                                 title  ...                                          needed_by
provider                                ...
earthdata               NASA Earthdata  ...  modis-snow, snow-classification, ucla-snow-rea...
earthengine               Earth Engine  ...  era5, huc, hydrobasins, snodas, forest-cover-f...
planetary_computer  Planetary Computer  ...
planet                          Planet  ...                                        planetscope
nve                         NVE HydAPI  ...                                       nve-stations

[5 rows x 6 columns]
Norwegian stations with SWE (parameter 2003) or snow depth (2002).
norway = (4.5, 57.5, 31.5, 71.5)
inv = esd.stations.inventory(norway, networks="nve", daily_only=True)
print(f"{len(inv)} NVE snow stations with a daily record")
27 NVE snow stations with a daily record
One water year at two long-running pillows.
obs = esd.stations.load(
    ["12.142.0", "121.2.0"], variables=["swe", "snwd"], time="2023-10/2024-09"
)

fig, ax = plt.subplots(figsize=(9, 4.5))
for station in obs["station"].values:
    name = str(obs["name"].sel(station=station).values)
    ax.plot(obs["dowy"], obs["swe"].sel(station=station), label=name)
ax.set_xlabel("day of water year (1 = 1 October)")
ax.set_ylabel(f"SWE ({obs['swe'].attrs['units']})")
ax.set_title("NVE snow pillows, water year 2024")
ax.legend()
fig.tight_layout()
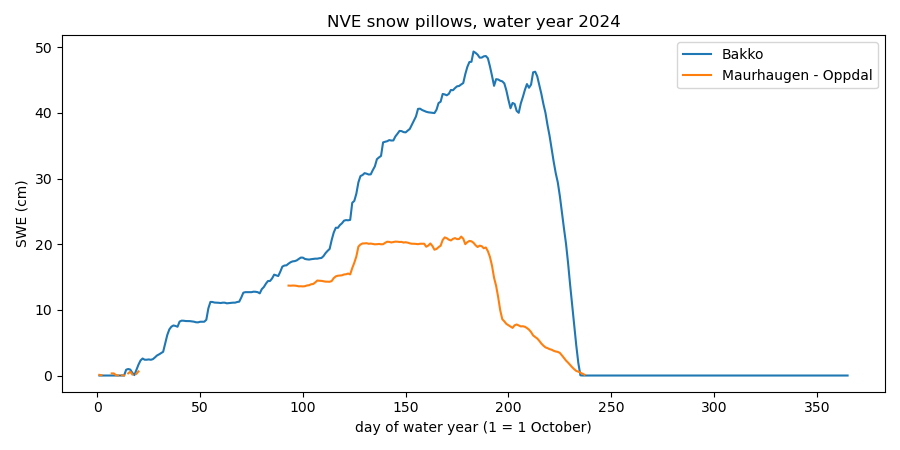
Norway’s melt season runs later than the western US at the same latitude, which the day-of-water-year axis makes easy to compare against the SNOTEL example in this gallery.