easysnowdata.plotting.points#
- easysnowdata.plotting.points(gdf: Any, ax: Any = None, *, column: str | None = None, title: str | None = None, legend: bool = True, legend_label: str | None = None, basemap: Any = True, scalebar: bool | dict[str, Any] = True, graticule: bool | dict[str, Any] = True, figsize: tuple[float, float] | None = None, pad: float = 0.05, **plot_kwargs: Any) Any[source]#
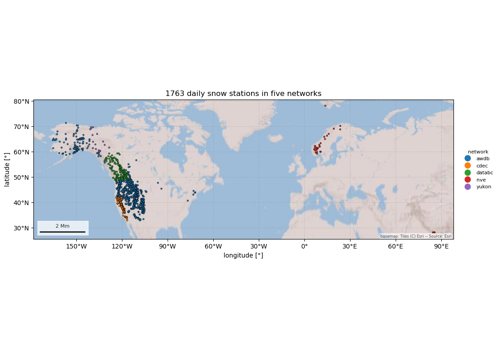
Draw a GeoDataFrame (stations, basins) over a basemap with the map conventions.
- Parameters:
gdf – Any GeoDataFrame; plotted in its own CRS.
column – Colour by this column: a colorbar for numbers, a legend for categories.
legend_label – Colorbar label; defaults to the column name.
basemap – On by default (
DEFAULT_BASEMAP); seeadd_basemap().pad – Fraction of the extent to add around the points.
**plot_kwargs – Passed to
geopandas.GeoDataFrame.plot()(markersize,cmap,edgecolor…).
- Returns: