Note
Go to the end to download the full example code.
Canadian historical SWE (CanSWE)#
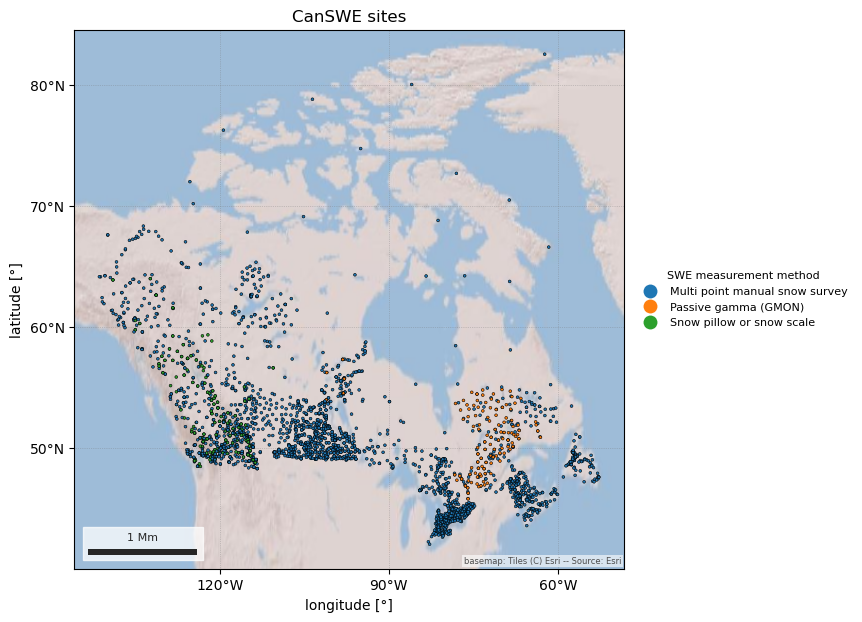
CanSWE (Vionnet et al., 2021) gathers SWE observations from Canada’s national, provincial and territorial agencies and hydropower companies into one quality controlled dataset, 1928 to the last snow season, updated once a year on Zenodo. Most of its ~3,000 sites are manual snow courses measured a few times a season; about 280 are automated snow pillows or passive-gamma (GMON) sensors with daily SWE. BC and Yukon sites overlap the DataBC and Yukon networks; the rest of the country is new.
CanSWEClient downloads the 14 MB netCDF from Zenodo once, converts it to a
~10 MB local Zarr store and deletes the download; later calls read the store.
It is not part of esd.stations.inventory() or load(). The data are under
the Open Government Licence – Canada, except Hydro-Québec’s, which are CC
BY-NC-SA 4.0.
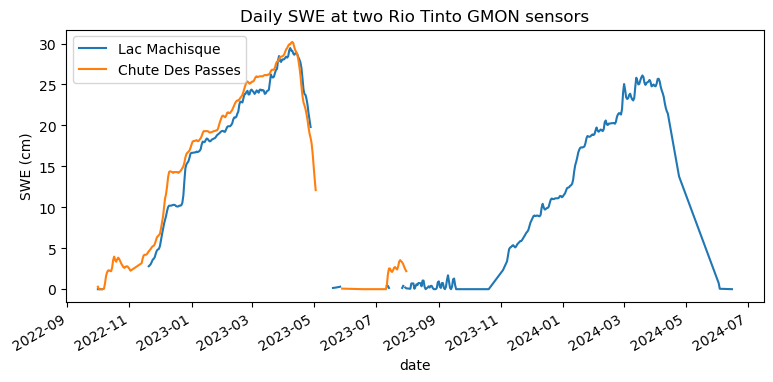
The figures show every site coloured by how it measures SWE, and two winters of daily SWE at two Rio Tinto gamma sensors in Quebec.
import geopandas as gpd
import pandas as pd

import easysnowdata as esd
from easysnowdata.stations.clients import CanSWEClient

client = CanSWEClient()
Every site, with its measurement method and whether it has daily SWE in at least one season (30 or more days with SWE > 0 in its densest 90 days).
stations = client.get_all_stations()
stations_gdf = gpd.GeoDataFrame(
    pd.DataFrame(stations).set_index("station_id"),
    geometry=gpd.points_from_xy(
        [s["longitude"] for s in stations], [s["latitude"] for s in stations]
    ),
    crs="EPSG:4326",
)
print(pd.crosstab(stations_gdf["method"], stations_gdf["status"]).to_string())
print(f"{stations_gdf['has_daily_swe'].sum()} sites with daily SWE in some season")
status                          Active  Inactive
method
Multi point manual snow survey     958      1722
Passive gamma (GMON)               116         5
Snow pillow or snow scale          139        23
282 sites with daily SWE in some season
Manual courses cover the whole country; automated sensors cluster in BC’s mountains and Quebec’s hydropower basins.
ax = esd.plotting.points(
    stations_gdf.cx[-142:-52, 41:84],
    column="method",
    legend_label="SWE measurement method",
    title="CanSWE sites",
    markersize=4,
    figsize=(11, 7),
)
/home/runner/work/easysnowdata/easysnowdata/docs/gallery/station_datasets/plot_canswe.py:48: GeographicAxesWarning: The data are in a geographic CRS (EPSG:4326), so one axis unit is a degree, not a metre. The axes use a latitude-corrected aspect (1/cos(62.3°) = 2.15) so shapes are not stretched; for a true equal-area grid load the product with crs='utm'.
  ax = esd.plotting.points(
Two gamma sensors in Quebec’s Saguenay–Lac-Saint-Jean region. With the
default interval="daily", every station comes back at its own cadence,
so a manual course in the same request would say "periodic".
records = client.get_data(
    ["RTA-CQMQ", "RTA-CWDT"],
    variables="swe",
    begin_date="2022-10-01",
    end_date="2024-06-30",
)
swe_df = pd.DataFrame(records)
print(swe_df.groupby(["station_id", "interval"]).size().to_string())
wide_df = swe_df.assign(date=lambda df: pd.to_datetime(df["date"])).pivot_table(
    index="date", columns="station_id", values="value"
)
wide_df.columns = [stations_gdf.loc[c, "name"].title() for c in wide_df.columns]
ax = wide_df.plot(figsize=(9, 4), title="Daily SWE at two Rio Tinto GMON sensors")
ax.set_ylabel("SWE (cm)")
station_id  interval
RTA-CQMQ    daily       405
RTA-CWDT    daily       253

Text(33.13947603154775, 0.5, 'SWE (cm)')
The manual courses are the bulk of the dataset. To keep only automated sites, filter the station list rather than the interval.
255 automated sites reported in the last season
British Columbia Environment               115
Hydro-Quebec                                94
Alberta Environment                         17
Rio Tinto Alcan                             14
Yukon Territory                              7
Manitoba Hydro                               5
Government of Newfoundland and Labrador      3