Note
Go to the end to download the full example code.
Every daily snow station at once#
The archive route reads what global_snow_networks pre-downloads: a
normalized inventory of every station across the five networks, and one daily
SWE / snow-depth CSV per station whose daily record has been probe-verified.
One ~28 MB download instead of five API sweeps, and it needs no credentials —
not even NVE’s, because the Norwegian stations are already in the bundle.
Roughly 1 550 stations by 47 000 days if you ask for all of it, so pass
time=, aoi= or stations= unless you really want every cell.
import matplotlib.pyplot as plt
import numpy as np

import easysnowdata as esd
The inventory is one HTTP request and carries the probe-verified
daily_or_better verdict, rather than what each network advertises.
inv = esd.stations.archive.inventory(daily_only=True)
print(inv["network"].value_counts().to_string())

fig, ax = plt.subplots(figsize=(10, 5))
inv.plot(ax=ax, column="network", legend=True, markersize=4)
ax.set_title(f"{len(inv)} probe-verified daily snow stations")
fig.tight_layout()
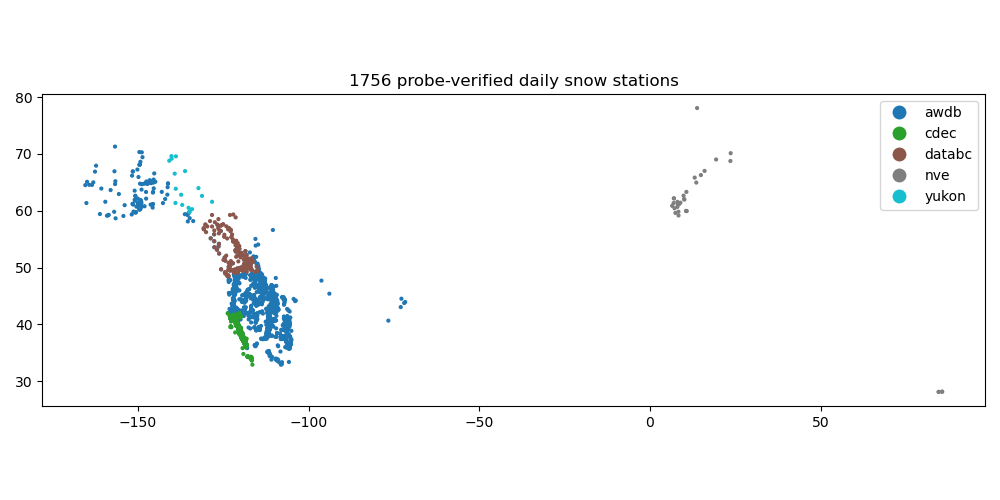
network
awdb      1210
cdec       345
databc     152
nve         32
yukon       17
One water year everywhere. The series are cut to the window before the dense grid is built, so this is far cheaper than loading the whole archive.
obs = esd.stations.archive.load(time="2023-10/2024-09")
print(obs)
Downloading data from 'https://github.com/egagli/global_snow_networks/raw/main/data/all_station_csvs.tar.xz' to file '/home/runner/.cache/easysnowdata/stations/all_station_csvs.tar.xz'.

  0%|                                              | 0.00/28.7M [00:00<?, ?B/s]
  7%|██▌                                  | 1.97M/28.7M [00:00<00:01, 19.7MB/s]
 40%|██████████████▉                      | 11.6M/28.7M [00:00<00:00, 64.4MB/s]
 77%|████████████████████████████▋        | 22.2M/28.7M [00:00<00:00, 83.6MB/s]
  0%|                                              | 0.00/28.7M [00:00<?, ?B/s]
100%|██████████████████████████████████████| 28.7M/28.7M [00:00<00:00, 142GB/s]
SHA256 hash of downloaded file: bcf4e33af60494a91ebe8faa3e93d089d53fd97c3d256c445915fb0054390438
Use this value as the 'known_hash' argument of 'pooch.retrieve' to ensure that the file hasn't changed if it is downloaded again in the future.
<xarray.Dataset> Size: 12MB
Dimensions:               (station: 1556, time: 366)
Coordinates: (12/29)
  * station               (station) <U16 100kB '0280_AK_COOP' ... 'WWC_CA_MSNT'
    network               (station) <U6 37kB 'awdb' 'awdb' ... 'cdec' 'awdb'
    name                  (station) <U41 255kB 'Anchorage Wscmo AP' ... 'West...
    client                (station) <U6 37kB 'awdb' 'awdb' ... 'cdec' 'awdb'
    network_code          (station) <U5 31kB 'COOP' 'COOP' ... 'CCSS' 'MSNT'
    network_name          (station) <U25 156kB '' '' '' '' '' ... '' '' '' '' ''
    ...                    ...
    daily_provenance      (station) <U6 37kB 'native' 'native' ... 'native'
    metadata_fetched_at   (station) <U19 118kB '2026-09-17 00:00:00' ... '202...
    station_id            (station) <U16 100kB '0280:AK:COOP' ... 'WWC:CA:MSNT'
  * time                  (time) datetime64[us] 3kB 2023-10-01 ... 2024-09-30
    water_year            (time) int64 3kB 2024 2024 2024 ... 2024 2024 2024
    dowy                  (time) int64 3kB 1 2 3 4 5 6 ... 362 363 364 365 366
Data variables:
    swe                   (station, time) float64 5MB nan nan nan ... 0.0 0.0
    snwd                  (station, time) float64 5MB 0.0 0.0 0.0 ... nan nan
Attributes:
    source:                github-tarball
    source_id:             github-tarball
    source_title:          global_snow_networks bundled archive
    source_url:            https://github.com/egagli/global_snow_networks/raw...
    product_id:            snow-station-archive
    title:                 Daily snow-station archive (global snow networks)
    data_citation:         Gagliano, E. Global snow networks: a documented in...
    license:               Per contributing network; see each network's produ...
    easysnowdata_version:  0.0.27.dev125+g480e638d6
    interval:              daily
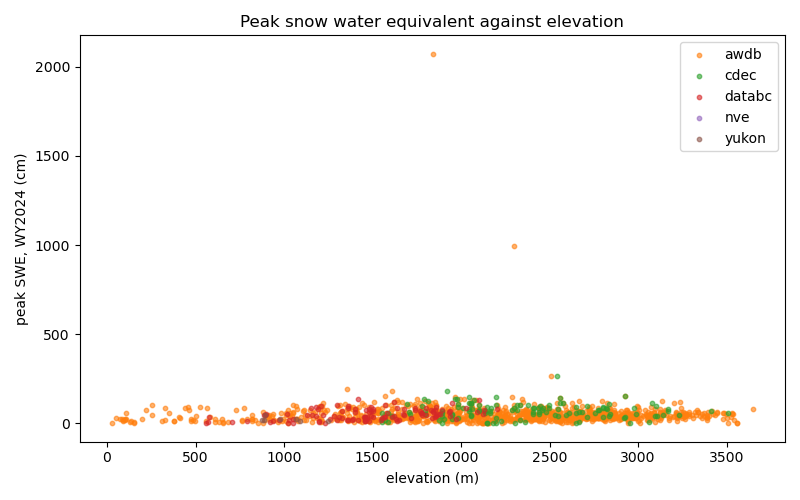
Peak SWE per station, against elevation, coloured by network.
peak = obs["swe"].max(dim="time")
fig, ax = plt.subplots(figsize=(8, 5))
for network in np.unique(obs["network"].values):
    rows = obs["network"] == network
    ax.scatter(
        obs["elevation_m"][rows], peak[rows], s=10, alpha=0.6, label=str(network)
    )
ax.set_xlabel("elevation (m)")
ax.set_ylabel(f"peak SWE, WY2024 ({obs['swe'].attrs['units']})")
ax.set_title("Peak snow water equivalent against elevation")
ax.legend()
fig.tight_layout()
For anything the archive does not hold — precipitation, temperature, wind,
quality flags, sub-daily data, or today’s observation — go to the networks
themselves with easysnowdata.stations.load().
Total running time of the script: (0 minutes 14.056 seconds)