Note
Go to the end to download the full example code.
Forest cover fraction below the treeline#
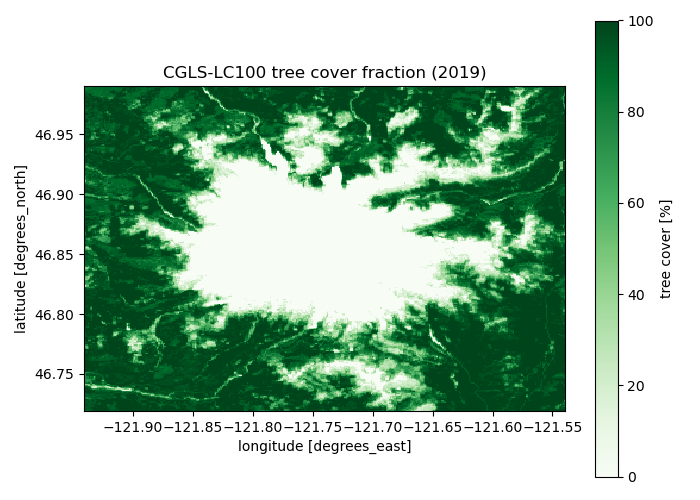
The CGLS-LC100 tree-cover fraction says how much of each 100 m pixel is canopy. Snow under canopy is what a satellite cannot see, so this layer is the usual companion to any optical snow-cover product.
import matplotlib.pyplot as plt

import easysnowdata as esd

aoi = (-121.94, 46.72, -121.54, 46.99)  # Mount Rainier, WA

forest = esd.land.forest_cover.load(aoi)

fig, ax = plt.subplots(figsize=(7, 5))
forest.plot.imshow(
    ax=ax, cmap="Greens", vmin=0, vmax=100, cbar_kwargs={"label": "tree cover [%]"}
)
ax.set_title("CGLS-LC100 tree cover fraction (2019)")
ax.set_aspect("equal")
fig.tight_layout()
Total running time of the script: (0 minutes 5.985 seconds)