easysnowdata.plotting.map#
- easysnowdata.plotting.map(da: DataArray, ax: Any = None, *, title: str | None = None, cbar_label: str | None = None, colorbar: bool = True, scalebar: bool | dict[str, Any] = True, graticule: bool | dict[str, Any] = True, basemap: Any = False, figsize: tuple[float, float] | None = None, **imshow_kwargs: Any) Any[source]#
Draw one raster as a map with the package’s conventions.
- Parameters:
da – A 2-D DataArray (a length-one
timeis squeezed) with a CRS on.rio/.odc.ax – Axes to draw on; a new figure sized to the data’s aspect otherwise.
title – Defaults to the array’s
long_nameplus its date when it has one.cbar_label – Defaults to
label(), i.e.long name [units].colorbar – Draw a colorbar matched to the map’s height.
scalebar – See
finish_map().graticule – See
finish_map().basemap – See
finish_map().figsize – Figure size when ax is
None; derived from the extent otherwise.**imshow_kwargs – Passed to
xarray.DataArray.plot.imshow()(cmap,vmin,vmax,norm…).
- Returns:
Examples using easysnowdata.plotting.map#
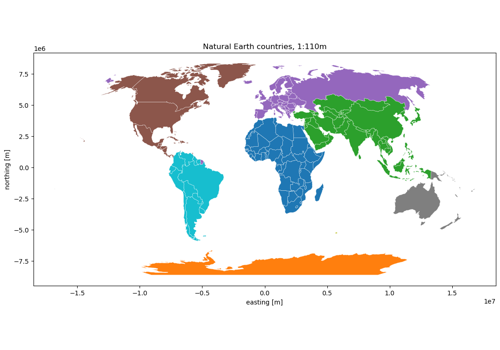
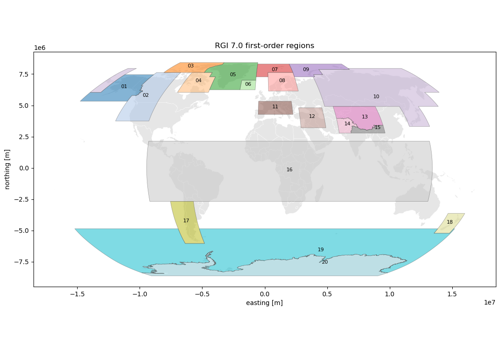
Glacier outlines: Randolph Glacier Inventory 7.0 and 6.0
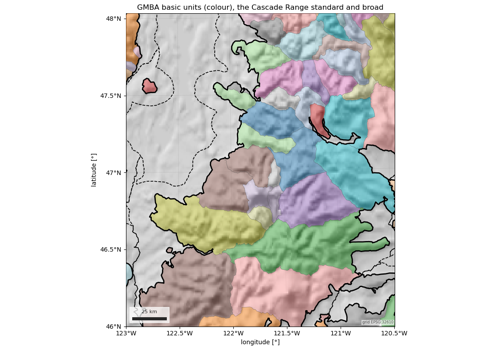
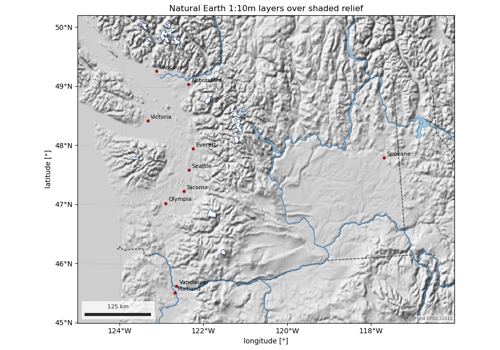
Natural Earth map layers: lakes, rivers, glaciers, places
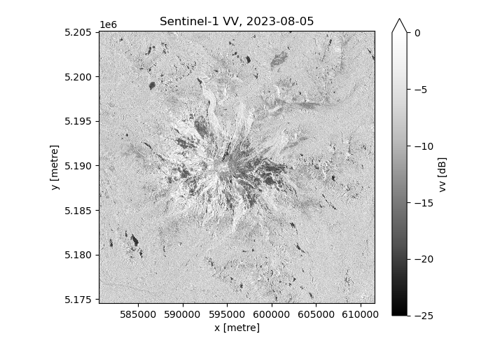
Sentinel-1 RTC backscatter and local incidence angle
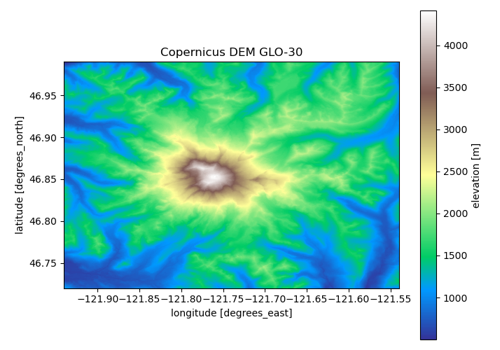
Digital elevation models: Copernicus, NASADEM, SRTM, 3DEP, ALOS, GEDTM30
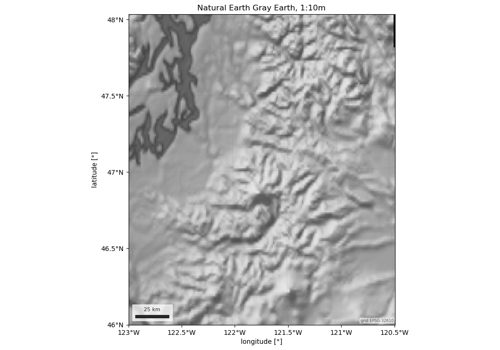
Hillshade: Natural Earth shaded relief as a basemap