Note
Go to the end to download the full example code.
VIIRS snow cover, the successor to MODIS#
Output from the last scheduled build
This example needs earthdata credentials. The figures and printed output
below come from the most recent scheduled build, which has them; this build
reused that output instead of re-running the example.
VIIRS carries the snow-cover record forward at 375 m as Terra winds down. The byte convention is the same as MODIS, so the same thresholding function works on both and the two can be compared directly over a winter.
Both products need an Earthdata account; the search and the read go through
the same earthdata provider.
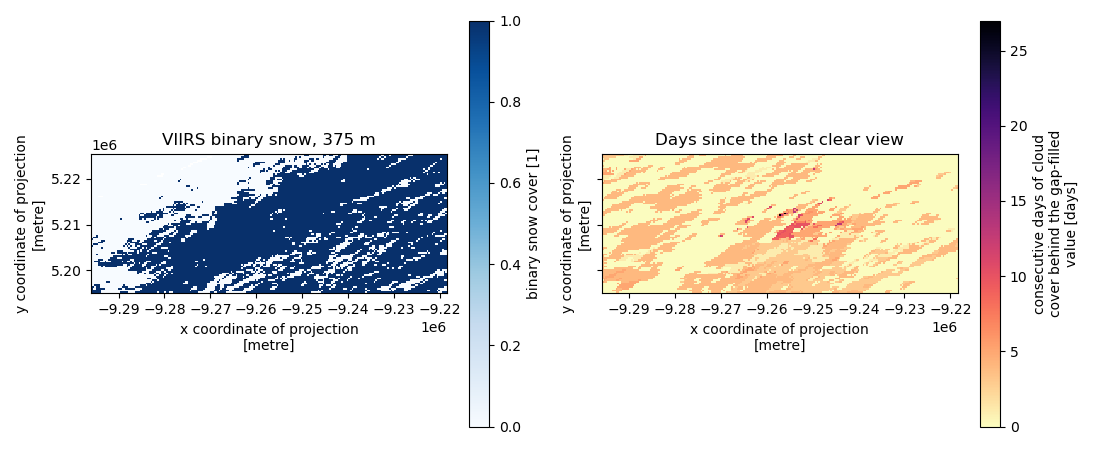
The cloud-gap-filled daily product. Cloud_Persistence says how old the
gap-filled value is, which is the number to check before trusting a pixel.
viirs = esd.snow.viirs.load(
    aoi,
    when,
    product="VNP10A1F",
    variables=["CGF_NDSI_Snow_Cover", "Cloud_Persistence"],
)
print(viirs)

snow = esd.processing.binary_snow(
    viirs["CGF_NDSI_Snow_Cover"], product="VNP10A1F", threshold=40
)

fig, axes = plt.subplots(1, 2, figsize=(11, 4.5), sharey=True)
snow.isel(time=0).plot.imshow(ax=axes[0], cmap="Blues", vmin=0, vmax=1)
axes[0].set_title("VIIRS binary snow, 375 m")
viirs["Cloud_Persistence"].isel(time=0).plot.imshow(ax=axes[1], cmap="magma_r")
axes[1].set_title("Days since the last clear view")
for ax in axes:
    ax.set_aspect("equal")
fig.tight_layout()
/home/runner/work/easysnowdata/easysnowdata/.pixi/envs/docs/lib/python3.13/site-packages/earthaccess/results.py:348: FutureWarning: As of version 1.0, `DataGranule.size` will be accessed as an attribute; e.g. use `DataCollection.size` **not** `DataCollection.size()`
  self["size"] = self.size()
/home/runner/work/easysnowdata/easysnowdata/.pixi/envs/docs/lib/python3.13/site-packages/earthaccess/store.py:838: FutureWarning: As of version 1.0, `DataGranule.size` will be accessed as an attribute; e.g. use `DataCollection.size` **not** `DataCollection.size()`
  total_size = round(sum(granule.size() for granule in granules) / 1024, 2)
<xarray.Dataset> Size: 277kB
Dimensions:              (time: 8, y: 82, x: 209)
Coordinates:
  * time                 (time) datetime64[us] 64B 2023-03-01 ... 2023-03-08
  * y                    (y) float64 656B 5.225e+06 5.225e+06 ... 5.195e+06
  * x                    (x) float64 2kB -9.296e+06 -9.295e+06 ... -9.219e+06
    Projection           int64 8B 0
Data variables:
    CGF_NDSI_Snow_Cover  (time, y, x) uint8 137kB dask.array<chunksize=(1, 82, 80), meta=np.ndarray>
    Cloud_Persistence    (time, y, x) uint8 137kB dask.array<chunksize=(1, 82, 80), meta=np.ndarray>
Attributes:
    source:                nsidc
    source_id:             nsidc
    source_title:          NSIDC (Earthdata)
    source_url:            https://nsidc.org/data/vnp10a1f/versions/2
    product_id:            viirs-snow
    title:                 VIIRS snow cover (VNP10A1, VNP10A1F)
    data_citation:         Riggs, G. A., Hall, D. K. and Román, M. O. (2019)....
    license:               NASA Earthdata (free registration)
    easysnowdata_version:  0.0.27.dev125+g480e638d6
    doi:                   10.5067/VIIRS/VNP10A1F.002
    viirs_product:         VNP10A1F
    version:               2
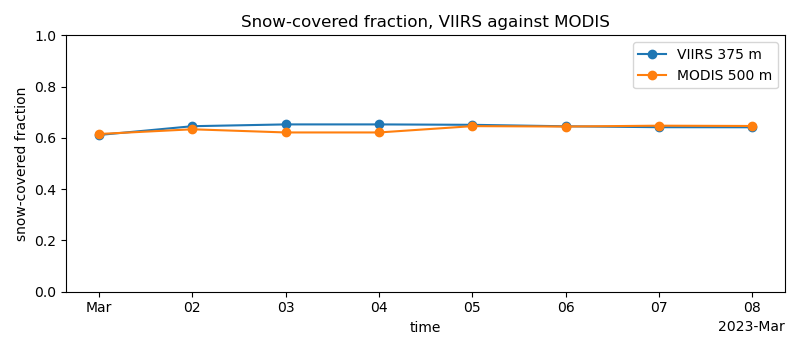
The same week from MODIS, at 500 m. The two records overlap from 2012, which is what makes a continuity check possible before Terra stops.
modis = esd.snow.modis.load(aoi, when, product="MOD10A1F")
modis_snow = esd.processing.binary_snow(
    modis["CGF_NDSI_Snow_Cover"], product="MOD10A1F", threshold=40
)

fig, ax = plt.subplots(figsize=(8, 3.5))
for label, series in (
    ("VIIRS 375 m", snow.mean(dim=["y", "x"]).compute()),
    ("MODIS 500 m", modis_snow.mean(dim=["y", "x"]).compute()),
):
    series.plot(ax=ax, marker="o", label=label)
ax.set_ylabel("snow-covered fraction")
ax.set_ylim(0, 1)
ax.legend()
ax.set_title("Snow-covered fraction, VIIRS against MODIS")
fig.tight_layout()

print(
    "mean difference:",
    float(
        np.nanmean(snow.mean(dim=["y", "x"]).values)
        - np.nanmean(modis_snow.mean(dim=["y", "x"]).values)
    ),
)
/home/runner/work/easysnowdata/easysnowdata/.pixi/envs/docs/lib/python3.13/site-packages/earthaccess/results.py:348: FutureWarning: As of version 1.0, `DataGranule.size` will be accessed as an attribute; e.g. use `DataCollection.size` **not** `DataCollection.size()`
  self["size"] = self.size()
/home/runner/work/easysnowdata/easysnowdata/.pixi/envs/docs/lib/python3.13/site-packages/earthaccess/store.py:838: FutureWarning: As of version 1.0, `DataGranule.size` will be accessed as an attribute; e.g. use `DataCollection.size` **not** `DataCollection.size()`
  total_size = round(sum(granule.size() for granule in granules) / 1024, 2)
/home/runner/work/easysnowdata/easysnowdata/.pixi/envs/docs/lib/python3.13/site-packages/rasterio/__init__.py:367: NotGeoreferencedWarning: Dataset has no geotransform, gcps, or rpcs. The identity matrix will be returned.
  dataset = DatasetReader(path, driver=driver, sharing=sharing, thread_safe=thread_safe, **kwargs)
/home/runner/work/easysnowdata/easysnowdata/.pixi/envs/docs/lib/python3.13/site-packages/rasterio/__init__.py:367: NotGeoreferencedWarning: Dataset has no geotransform, gcps, or rpcs. The identity matrix will be returned.
  dataset = DatasetReader(path, driver=driver, sharing=sharing, thread_safe=thread_safe, **kwargs)
/home/runner/work/easysnowdata/easysnowdata/.pixi/envs/docs/lib/python3.13/site-packages/rasterio/__init__.py:367: NotGeoreferencedWarning: Dataset has no geotransform, gcps, or rpcs. The identity matrix will be returned.
  dataset = DatasetReader(path, driver=driver, sharing=sharing, thread_safe=thread_safe, **kwargs)
/home/runner/work/easysnowdata/easysnowdata/.pixi/envs/docs/lib/python3.13/site-packages/rasterio/__init__.py:367: NotGeoreferencedWarning: Dataset has no geotransform, gcps, or rpcs. The identity matrix will be returned.
  dataset = DatasetReader(path, driver=driver, sharing=sharing, thread_safe=thread_safe, **kwargs)
/home/runner/work/easysnowdata/easysnowdata/.pixi/envs/docs/lib/python3.13/site-packages/rasterio/__init__.py:367: NotGeoreferencedWarning: Dataset has no geotransform, gcps, or rpcs. The identity matrix will be returned.
  dataset = DatasetReader(path, driver=driver, sharing=sharing, thread_safe=thread_safe, **kwargs)
/home/runner/work/easysnowdata/easysnowdata/.pixi/envs/docs/lib/python3.13/site-packages/rasterio/__init__.py:367: NotGeoreferencedWarning: Dataset has no geotransform, gcps, or rpcs. The identity matrix will be returned.
  dataset = DatasetReader(path, driver=driver, sharing=sharing, thread_safe=thread_safe, **kwargs)
/home/runner/work/easysnowdata/easysnowdata/.pixi/envs/docs/lib/python3.13/site-packages/rasterio/__init__.py:367: NotGeoreferencedWarning: Dataset has no geotransform, gcps, or rpcs. The identity matrix will be returned.
  dataset = DatasetReader(path, driver=driver, sharing=sharing, thread_safe=thread_safe, **kwargs)
/home/runner/work/easysnowdata/easysnowdata/.pixi/envs/docs/lib/python3.13/site-packages/rasterio/__init__.py:367: NotGeoreferencedWarning: Dataset has no geotransform, gcps, or rpcs. The identity matrix will be returned.
  dataset = DatasetReader(path, driver=driver, sharing=sharing, thread_safe=thread_safe, **kwargs)
mean difference: 0.008269667625427246
Total running time of the script: (0 minutes 9.074 seconds)