easysnowdata.plotting.timeseries#
- easysnowdata.plotting.timeseries(obj: DataArray | Dataset, ax: Any = None, *, variable: str | None = None, hue: str | None = None, labels: dict[Any, str] | None = None, title: str | None = None, by_water_year: bool = False, hemisphere: str = 'northern', legend: bool = True, figsize: tuple[float, float] = (9, 4), **plot_kwargs: Any) Any[source]#
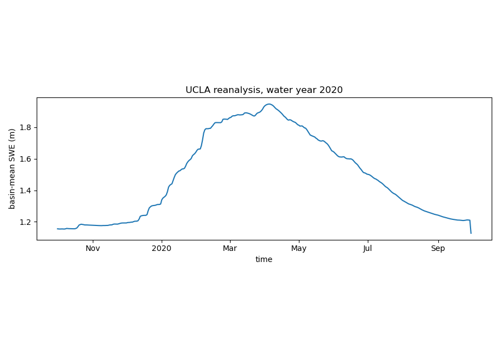
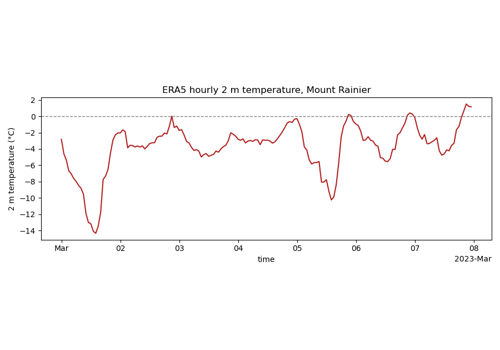
Plot a time series, one line per hue value, against calendar dates.
- Parameters:
obj – A DataArray with a
timedim, or a Dataset with variable named.hue – Dimension to draw one line per value of (default: the non-time dim when there is exactly one, e.g.
station).labels –
{hue value: legend text}; defaults to thenameandelevation_mcoordinates when present, else the value itself.by_water_year – Overlay each water year on one October-to-September axis (month names) instead of a continuous calendar. The lines are labelled by water year, and hue must then be absent or of length one.
hemisphere – For by_water_year:
"northern"(1 October) or"southern".**plot_kwargs – Passed to
Axes.plot(linewidth,alpha,color…).
- Returns:
Examples using easysnowdata.plotting.timeseries#
Sentinel-1 RTC backscatter and local incidence angle