Note
Go to the end to download the full example code.
ERA5 hourly temperature over Mount Rainier#
Hourly 2 m temperature from ARCO-ERA5 on Google Cloud Storage: no credentials,
one week behind real time through ERA5T. The same call reaches ERA5-Land and
the daily / monthly aggregates with source="gee".
import matplotlib.pyplot as plt

import easysnowdata as esd

aoi = (-121.94, 46.72, -121.54, 46.99)  # Mount Rainier
Load one week of hourly 2 m temperature. The result is Dask-backed, with
time/latitude/longitude dims because the grid is geographic.
era5 = esd.climate.era5.load(
    aoi, "2023-03-01/2023-03-07", variables=["2m_temperature", "snow_depth"]
)
print(era5)
<xarray.Dataset> Size: 3kB
Dimensions:         (time: 168, latitude: 1, longitude: 1)
Coordinates:
  * time            (time) datetime64[ns] 1kB 2023-03-01 ... 2023-03-07T23:00:00
  * latitude        (latitude) float32 4B 46.75
  * longitude       (longitude) float32 4B -121.8
    spatial_ref     int64 8B 0
Data variables:
    2m_temperature  (time, latitude, longitude) float32 672B dask.array<chunksize=(24, 1, 1), meta=np.ndarray>
    snow_depth      (time, latitude, longitude) float32 672B dask.array<chunksize=(24, 1, 1), meta=np.ndarray>
Attributes: (12/16)
    valid_time_start:       1940-01-01
    valid_time_stop:        2026-06-30
    valid_time_stop_era5t:  2026-09-11
    last_updated:           2026-09-17 08:28:35.393445+00:00
    source:                 arco-era5-gcs
    source_id:              arco-era5-gcs
    ...                     ...
    data_citation:          Hersbach, H., et al. (2020). The ERA5 global rean...
    license:                Copernicus licence
    easysnowdata_version:   0.0.27.dev125+g480e638d6
    doi:                    10.1002/qj.3803
    version:                ERA5
    cadence:                hourly
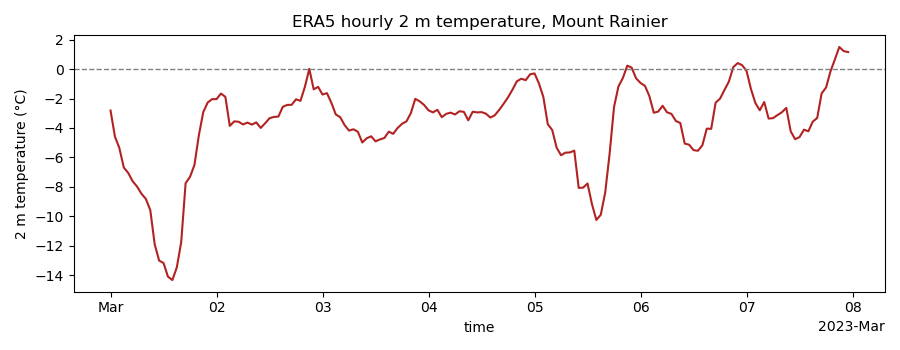
The domain average through the week, in degrees Celsius.
t2m = (era5["2m_temperature"].mean(dim=["latitude", "longitude"]) - 273.15).compute()

fig, ax = plt.subplots(figsize=(9, 3.5))
t2m.plot(ax=ax, color="firebrick")
ax.axhline(0, color="0.5", linestyle="--", linewidth=1)
ax.set_ylabel("2 m temperature (°C)")
ax.set_title("ERA5 hourly 2 m temperature, Mount Rainier")
fig.tight_layout()
Provenance travels with the data: which route served it, the citation, the licence, and where the final ERA5 archive ends and preliminary ERA5T begins.
for key in ("source", "source_url", "product_id", "license", "valid_time_stop"):
    print(f"{key}: {era5.attrs[key]}")
source: arco-era5-gcs
source_url: https://github.com/google-research/arco-era5
product_id: era5
license: Copernicus licence
valid_time_stop: 2026-06-30