Note
Go to the end to download the full example code.
Finnish daily snow depth (FMI)#
The Finnish Meteorological Institute (FMI) publishes daily snow depth from its automatic weather stations and its manual precipitation and climate stations through its open-data WFS (CC BY 4.0), from 1895 at Helsinki Kaisaniemi and from 1959 at most stations. It publishes no SWE; Finnish snow-course SWE is Syke’s.
FMIClient reads the service, with no account. It lists open and closed
stations; some closed ones are unknown to the observation service and are
skipped when data is asked for. Station codes in esd.stations are
FMI-<fmisid>.
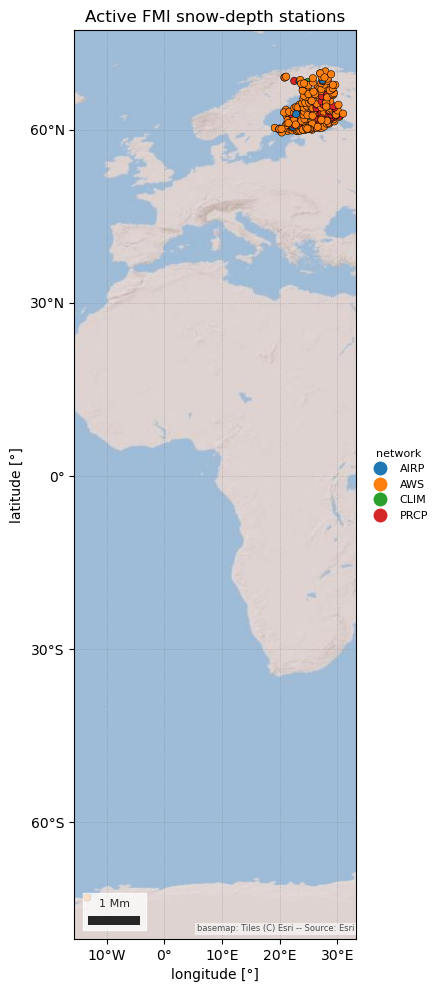
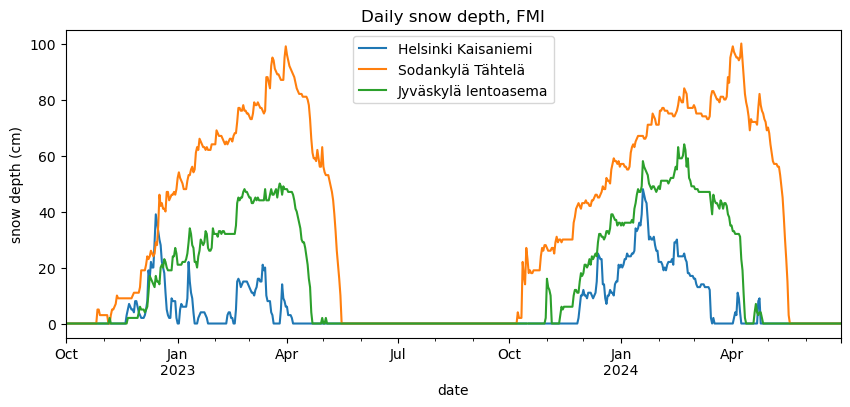
The figures show the stations by network and status, and two winters of daily snow depth at four stations from south to north.
import geopandas as gpd
import pandas as pd

import easysnowdata as esd
from easysnowdata.stations.clients import FMIClient

client = FMIClient()
Every station of the networks that report snow depth. network_code is
the station’s main network: AWS (automatic weather station), AIRP
(airport), CLIM (climate), WS (manned weather station) or PRCP
(precipitation).
stations = client.get_all_stations()
stations_gdf = gpd.GeoDataFrame(
    pd.DataFrame(stations).set_index("station_id"),
    geometry=gpd.points_from_xy(
        [s["longitude"] for s in stations], [s["latitude"] for s in stations]
    ),
    crs="EPSG:4326",
)
print(pd.crosstab(stations_gdf["network_code"], stations_gdf["status"]).to_string())

ax = esd.plotting.points(
    stations_gdf[stations_gdf["status"] == "Active"],
    column="network_code",
    legend_label="network",
    title="Active FMI snow-depth stations",
)
status        Active  Inactive
network_code
AIRP              15         9
AWS              185        74
CLIM               2        22
PRCP              52      1866
WS                 0       233
/home/runner/work/easysnowdata/easysnowdata/docs/gallery/station_datasets/plot_fmi.py:42: GeographicAxesWarning: The data are in a geographic CRS (EPSG:4326), so one axis unit is a degree, not a metre. The axes use a latitude-corrected aspect (1/cos(-1.5°) = 1.00) so shapes are not stretched; for a true equal-area grid load the product with crs='utm'.
  ax = esd.plotting.points(
Daily snow depth at Helsinki Kaisaniemi, Jyväskylä airport, Oulu airport
and Sodankylä Tähtelä. At automatic stations a value is the 06:00 UTC
reading of its day; -1 (snow-free ground) arrives as 0 cm.
ids = ["100971", "137208", "101786", "101932"]
records = client.get_data(ids, begin_date="2022-10-01", end_date="2024-06-30")
depth_df = (
    pd.DataFrame(records)
    .assign(date=lambda df: pd.to_datetime(df["date"]))
    .pivot_table(index="date", columns="station_id", values="value")
)
depth_df.columns = [stations_gdf.loc[c, "name"] for c in depth_df.columns]
ax = depth_df.plot(figsize=(10, 4))
ax.set(ylabel="snow depth (cm)", title="Daily snow depth, FMI")
[Text(23.999999999999993, 0.5, 'snow depth (cm)'), Text(0.5, 1.0, 'Daily snow depth, FMI')]
Total running time of the script: (0 minutes 10.630 seconds)