Note
Go to the end to download the full example code.
Yukon snow courses and automated stations#
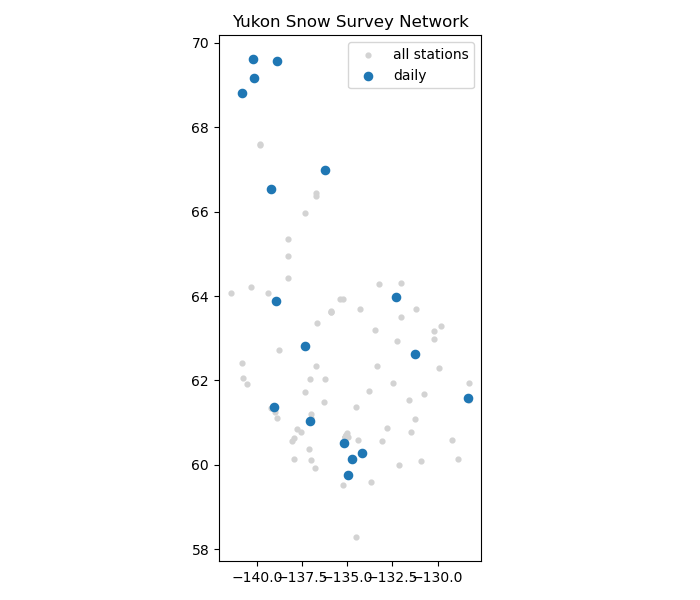
The Yukon Snow Survey Network mixes automated snow-weather stations reporting
daily with manual snow courses surveyed monthly through the winter, and the
Yukon Water Data API also mirrors ECCC meteorological stations. A few courses
the survey operates sit in northern BC and Alaska, so state is not always
YT.
import matplotlib.pyplot as plt

import easysnowdata as esd

yukon = (-142.0, 58.0, -123.0, 70.0)
Everything, then the automated subset.
everything = esd.stations.inventory(yukon, networks="yukon")
daily = esd.stations.inventory(yukon, networks="yukon", daily_only=True)
print(f"{len(everything)} Yukon stations, {len(daily)} reporting daily")
109 Yukon stations, 17 reporting daily
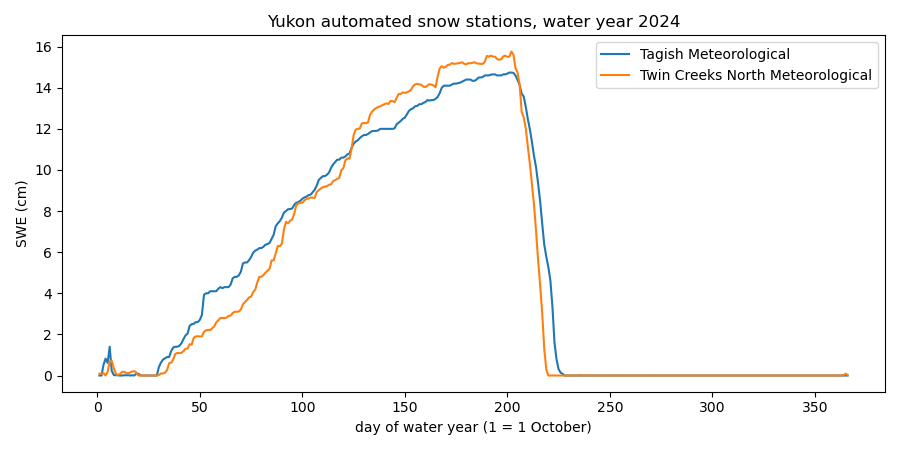
A season at two automated sites.
obs = esd.stations.load(
    ["09AA-M1", "09BA-M7"], variables=["swe", "snwd"], time="2023-10/2024-09"
)

fig, ax = plt.subplots(figsize=(9, 4.5))
for station in obs["station"].values:
    name = str(obs["name"].sel(station=station).values)
    ax.plot(obs["dowy"], obs["swe"].sel(station=station), label=name)
ax.set_xlabel("day of water year (1 = 1 October)")
ax.set_ylabel(f"SWE ({obs['swe'].attrs['units']})")
ax.set_title("Yukon automated snow stations, water year 2024")
ax.legend()
fig.tight_layout()
The courses, which are periodic rather than daily, sit alongside them.
fig, ax = plt.subplots(figsize=(7, 6))
everything.plot(ax=ax, color="lightgrey", markersize=12, label="all stations")
daily.plot(ax=ax, color="tab:blue", markersize=35, label="daily")
ax.legend()
ax.set_title("Yukon Snow Survey Network")
fig.tight_layout()