Note
Go to the end to download the full example code.
CHILI heat-load index on Mount Rainier#
Output from the last scheduled build
This example needs earthengine credentials. The figures and printed output
below come from the most recent scheduled build, which has them; this build
reused that output instead of re-running the example.
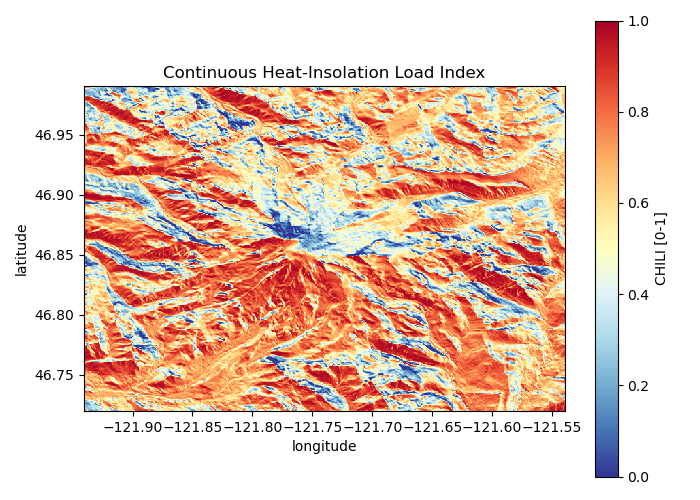
CHILI combines slope, aspect and latitude into one index of the heat load a pixel receives. Cool, north-facing slopes hold snow later in the season than the warm slopes across the valley.
Needs Earth Engine credentials (esd.auth.login("earthengine")).
/home/runner/work/easysnowdata/easysnowdata/.pixi/envs/docs/lib/python3.13/site-packages/xee/ext.py:615: UserWarning: Unable to retrieve 'system:time_start' values from an ImageCollection due to: No 'system:time_start' values found in the 'ImageCollection'.
  warnings.warn(
import matplotlib.pyplot as plt

import easysnowdata as esd

aoi = (-121.94, 46.72, -121.54, 46.99)  # Mount Rainier, WA

# normalize="index" undoes the asset's 8-bit scaling: 0 is coolest, 1 warmest.
chili = esd.terrain.chili.load(aoi, normalize="index")

fig, ax = plt.subplots(figsize=(7, 5))
chili.plot.imshow(
    ax=ax, cmap="RdYlBu_r", vmin=0, vmax=1, cbar_kwargs={"label": "CHILI [0-1]"}
)
ax.set_title("Continuous Heat-Insolation Load Index")
ax.set_aspect("equal")
fig.tight_layout()