Note
Go to the end to download the full example code.
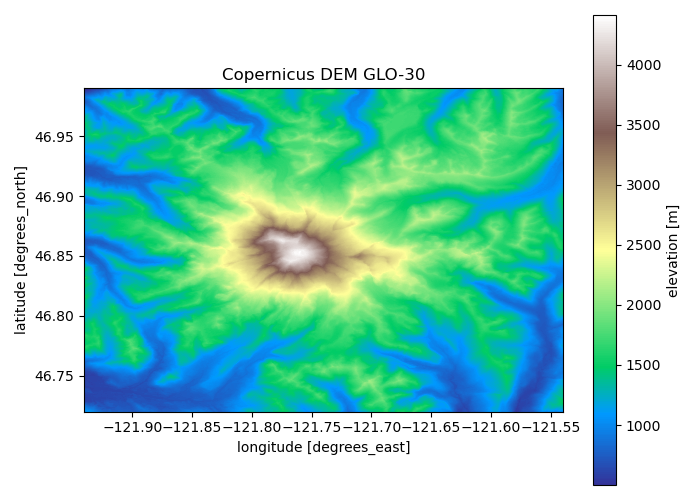
Copernicus DEM around Mount Rainier#
The 30 m Copernicus digital surface model, loaded from the Planetary Computer
and shaded by elevation. source="earth-search" reads the same 2021 release
from the unsigned AWS Open Data bucket instead.
import matplotlib.pyplot as plt

import easysnowdata as esd

aoi = (-121.94, 46.72, -121.54, 46.99)  # Mount Rainier, WA

dem = esd.terrain.dem.load(aoi, resolution=30)

fig, ax = plt.subplots(figsize=(7, 5))
dem.plot.imshow(ax=ax, cmap="terrain", cbar_kwargs={"label": "elevation [m]"})
ax.set_title("Copernicus DEM GLO-30")
ax.set_aspect("equal")
fig.tight_layout()