Note
Go to the end to download the full example code.
Where mountain snow is seasonal#
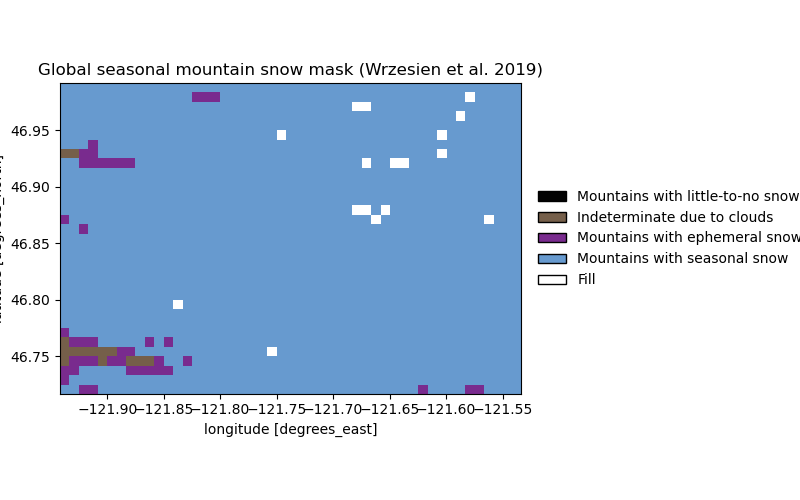
Wrzesien et al. separate mountains with seasonal snow from mountains with ephemeral snow, which is the distinction that decides whether a basin stores water as snow through the winter.
The Zenodo archive is cached on the first call, so re-running this is fast.
  0%|                                              | 0.00/13.7M [00:00<?, ?B/s]
  0%|                                     | 11.3k/13.7M [00:00<02:27, 92.3kB/s]
  0%|                                      | 37.9k/13.7M [00:00<01:21, 167kB/s]
  1%|▎                                      | 108k/13.7M [00:00<00:38, 351kB/s]
  1%|▍                                      | 173k/13.7M [00:00<00:31, 424kB/s]
  2%|▊                                      | 297k/13.7M [00:00<00:21, 636kB/s]
  3%|█▏                                     | 428k/13.7M [00:00<00:16, 784kB/s]
  5%|█▊                                    | 673k/13.7M [00:00<00:10, 1.18MB/s]
  7%|██▌                                   | 919k/13.7M [00:00<00:08, 1.45MB/s]
 10%|███▊                                 | 1.39M/13.7M [00:01<00:05, 2.21MB/s]
 14%|█████                                | 1.88M/13.7M [00:01<00:04, 2.76MB/s]
 21%|███████▌                             | 2.81M/13.7M [00:01<00:02, 4.25MB/s]
 26%|█████████▋                           | 3.60M/13.7M [00:01<00:02, 4.91MB/s]
 37%|█████████████▊                       | 5.09M/13.7M [00:01<00:01, 7.52MB/s]
 43%|███████████████▉                     | 5.88M/13.7M [00:01<00:01, 7.34MB/s]
 65%|████████████████████████▏            | 8.93M/13.7M [00:01<00:00, 12.9MB/s]
 88%|████████████████████████████████▋    | 12.1M/13.7M [00:01<00:00, 16.8MB/s]
  0%|                                              | 0.00/13.7M [00:00<?, ?B/s]
100%|█████████████████████████████████████| 13.7M/13.7M [00:00<00:00, 72.7GB/s]
import matplotlib.pyplot as plt

import easysnowdata as esd

aoi = (-121.94, 46.72, -121.54, 46.99)  # Mount Rainier, WA

mountain_snow = esd.snow.mountain_snow_mask.load(aoi, layer="mountain_snow")

ax = esd.plotting.categorical(mountain_snow, figsize=(8, 5))
ax.set_title("Global seasonal mountain snow mask (Wrzesien et al. 2019)")
plt.tight_layout()
Total running time of the script: (0 minutes 26.860 seconds)