Note
Go to the end to download the full example code.
SNOTEL snow water equivalent at Mount Rainier#
The AWDB network — SNOTEL and SNOLITE telemetry sites, SCAN, and the manual
snow courses — through easysnowdata.stations. No credentials.
inventory() answers “which stations are here” as a GeoDataFrame, and
load() turns the ones you pick into a (station, time) Dataset with
water-year coordinates already attached.
import matplotlib.pyplot as plt

import easysnowdata as esd

aoi = (-122.1, 46.6, -121.3, 47.1)  # Mount Rainier, WA
Every AWDB station in the box whose daily record has been probe-verified.
inv = esd.stations.inventory(aoi, networks="awdb", daily_only=True)
print(inv[["name", "network_code", "elevation_m", "state"]].to_string())
                           name network_code  elevation_m state
code
375_WA_SNTL       Bumping Ridge         SNTL       1402.1    WA
942_WA_SNTL      Burnt Mountain         SNTL       1268.0    WA
1085_WA_SNTL        Cayuse Pass         SNTL       1603.2    WA
418_WA_SNTL         Corral Pass         SNTL       1770.9    WA
928_WA_SNTL   Huckleberry Creek         SNTL        685.8    WA
642_WA_SNTL          Morse Lake         SNTL       1645.9    WA
941_WA_SNTL              Mowich         SNTL        966.2    WA
679_WA_SNTL            Paradise         SNTL       1569.7    WA
692_WA_SNTL        Pigtail Peak         SNTL       1767.8    WA
1257_WA_SNTL        Skate Creek         SNTL       1149.1    WA
863_WA_SNTL     White Pass E.S.         SNTL       1353.3    WA
One water year of SWE and snow depth for all of them. Values are centimetres, the unit the networks themselves report.
obs = esd.stations.load(inv, variables=["swe", "snwd"], time="2023-10/2024-09")
print(obs)
<xarray.Dataset> Size: 84kB
Dimensions:               (station: 11, time: 366)
Coordinates: (12/28)
  * station               (station) <U12 528B '375_WA_SNTL' ... '863_WA_SNTL'
    network               (station) <U4 176B 'awdb' 'awdb' ... 'awdb' 'awdb'
    name                  (station) <U17 748B 'Bumping Ridge' ... 'White Pass...
    client                (station) <U4 176B 'awdb' 'awdb' ... 'awdb' 'awdb'
    network_code          (station) <U4 176B 'SNTL' 'SNTL' ... 'SNTL' 'SNTL'
    latitude              (station) float64 88B 46.81 47.04 ... 46.64 46.64
    ...                    ...
    daily_provenance      (station) <U6 264B 'native' 'native' ... 'native'
    metadata_fetched_at   (station) <U19 836B '2026-09-17 00:00:00' ... '2026...
    station_id            (station) <U12 528B '375:WA:SNTL' ... '863:WA:SNTL'
  * time                  (time) datetime64[us] 3kB 2023-10-01 ... 2024-09-30
    water_year            (time) int64 3kB 2024 2024 2024 ... 2024 2024 2024
    dowy                  (time) int64 3kB 1 2 3 4 5 6 ... 362 363 364 365 366
Data variables:
    snwd                  (station, time) float64 32kB 0.0 0.0 0.0 ... 0.0 0.0
    swe                   (station, time) float64 32kB 0.0 0.0 0.0 ... 0.0 0.0
Attributes:
    source:                awdb
    source_id:             awdb
    source_title:          USDA NRCS AWDB REST API v1
    source_url:            https://wcc.sc.egov.usda.gov/awdbRestApi/services/v1
    product_id:            awdb-stations
    title:                 SNOTEL, SCAN and snow-course observations (USDA NR...
    data_citation:         USDA Natural Resources Conservation Service, Natio...
    license:               Public domain (US government data)
    easysnowdata_version:  0.0.27.dev125+g480e638d6
    interval:              daily
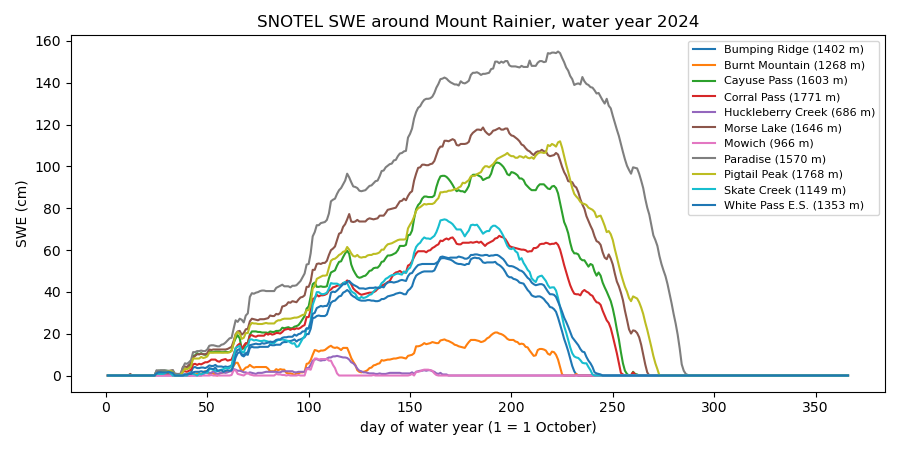
dowy is a plain integer coordinate, so it can be swapped in as the axis
to compare stations on a common water-year calendar.
fig, ax = plt.subplots(figsize=(9, 4.5))
for station in obs["station"].values:
    series = obs["swe"].sel(station=station)
    ax.plot(
        obs["dowy"],
        series,
        label=f"{str(obs['name'].sel(station=station).values)} "
        f"({float(obs['elevation_m'].sel(station=station)):.0f} m)",
    )
ax.set_xlabel("day of water year (1 = 1 October)")
ax.set_ylabel(f"SWE ({obs['swe'].attrs['units']})")
ax.set_title("SNOTEL SWE around Mount Rainier, water year 2024")
ax.legend(fontsize=8)
fig.tight_layout()
Total running time of the script: (0 minutes 5.172 seconds)