easysnowdata.plotting.add_outline#
- easysnowdata.plotting.add_outline(ax: Any, gdf: Any, crs: Any = None, *, label: str | None = None, keep_extent: bool = True, **plot_kwargs: Any) Any[source]#
Draw gdf (boundaries, basins, glaciers) over a map, in the map’s CRS.
- Parameters:
ax – Axes a map was drawn on (by
map(),categorical()orpoints()).gdf – Polygons or lines; reprojected to the map’s CRS.
crs – The map’s CRS. Defaults to the one
finish_map()recorded on ax, else EPSG:4326.label – Legend entry for the outlines.
keep_extent – Keep the map’s extent rather than zooming out to the whole outlines (a state or country usually reaches far beyond the map).
**plot_kwargs – Passed to
geopandas.GeoDataFrame.plot(); the defaults areedgecolor="black",linewidth=0.8and no fill. Passcolumn=(withcmap=,legend=…) orfacecolor=to fill the polygons as well.
- Returns:
Examples using easysnowdata.plotting.add_outline#
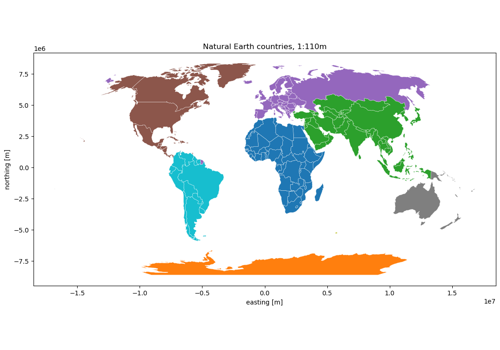
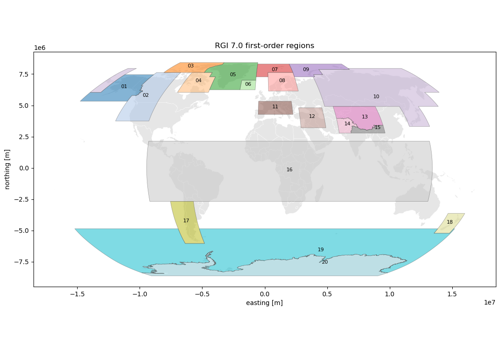
Glacier outlines: Randolph Glacier Inventory 7.0 and 6.0
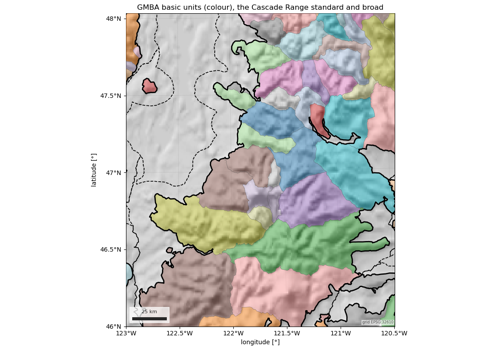
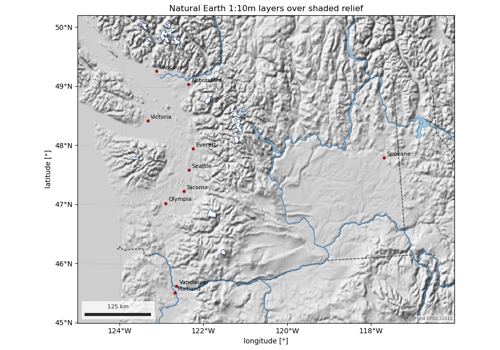
Natural Earth map layers: lakes, rivers, glaciers, places