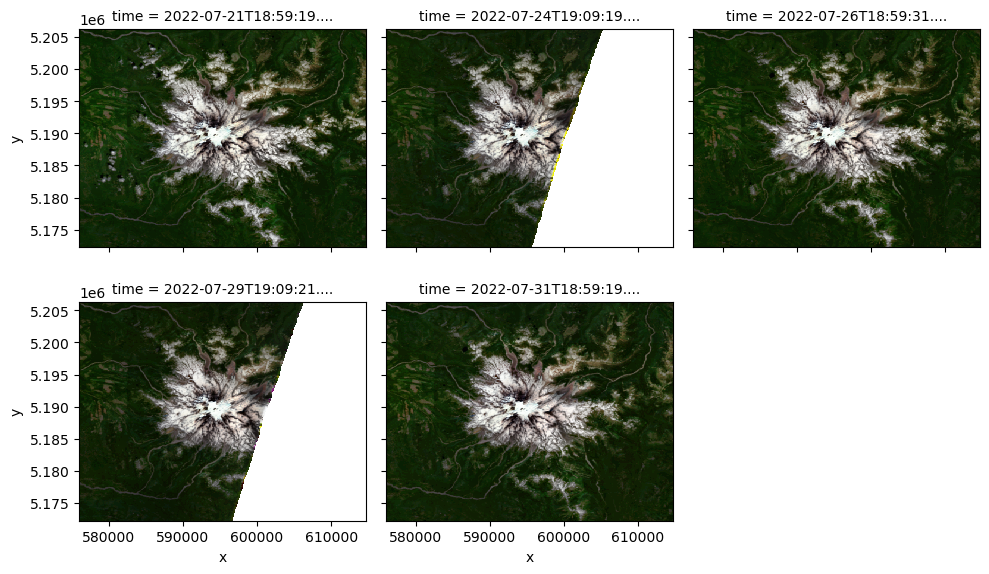
How easy to use is easysnowdata?#
import easysnowdata
bbox = (-122.0, 46.7, -121.5, 47.0)
snow_classification_da = easysnowdata.remote_sensing.get_esa_worldcover(bbox)
#snow_classification_da
f,ax = snow_classification_da.attrs['example_plot'](snow_classification_da)
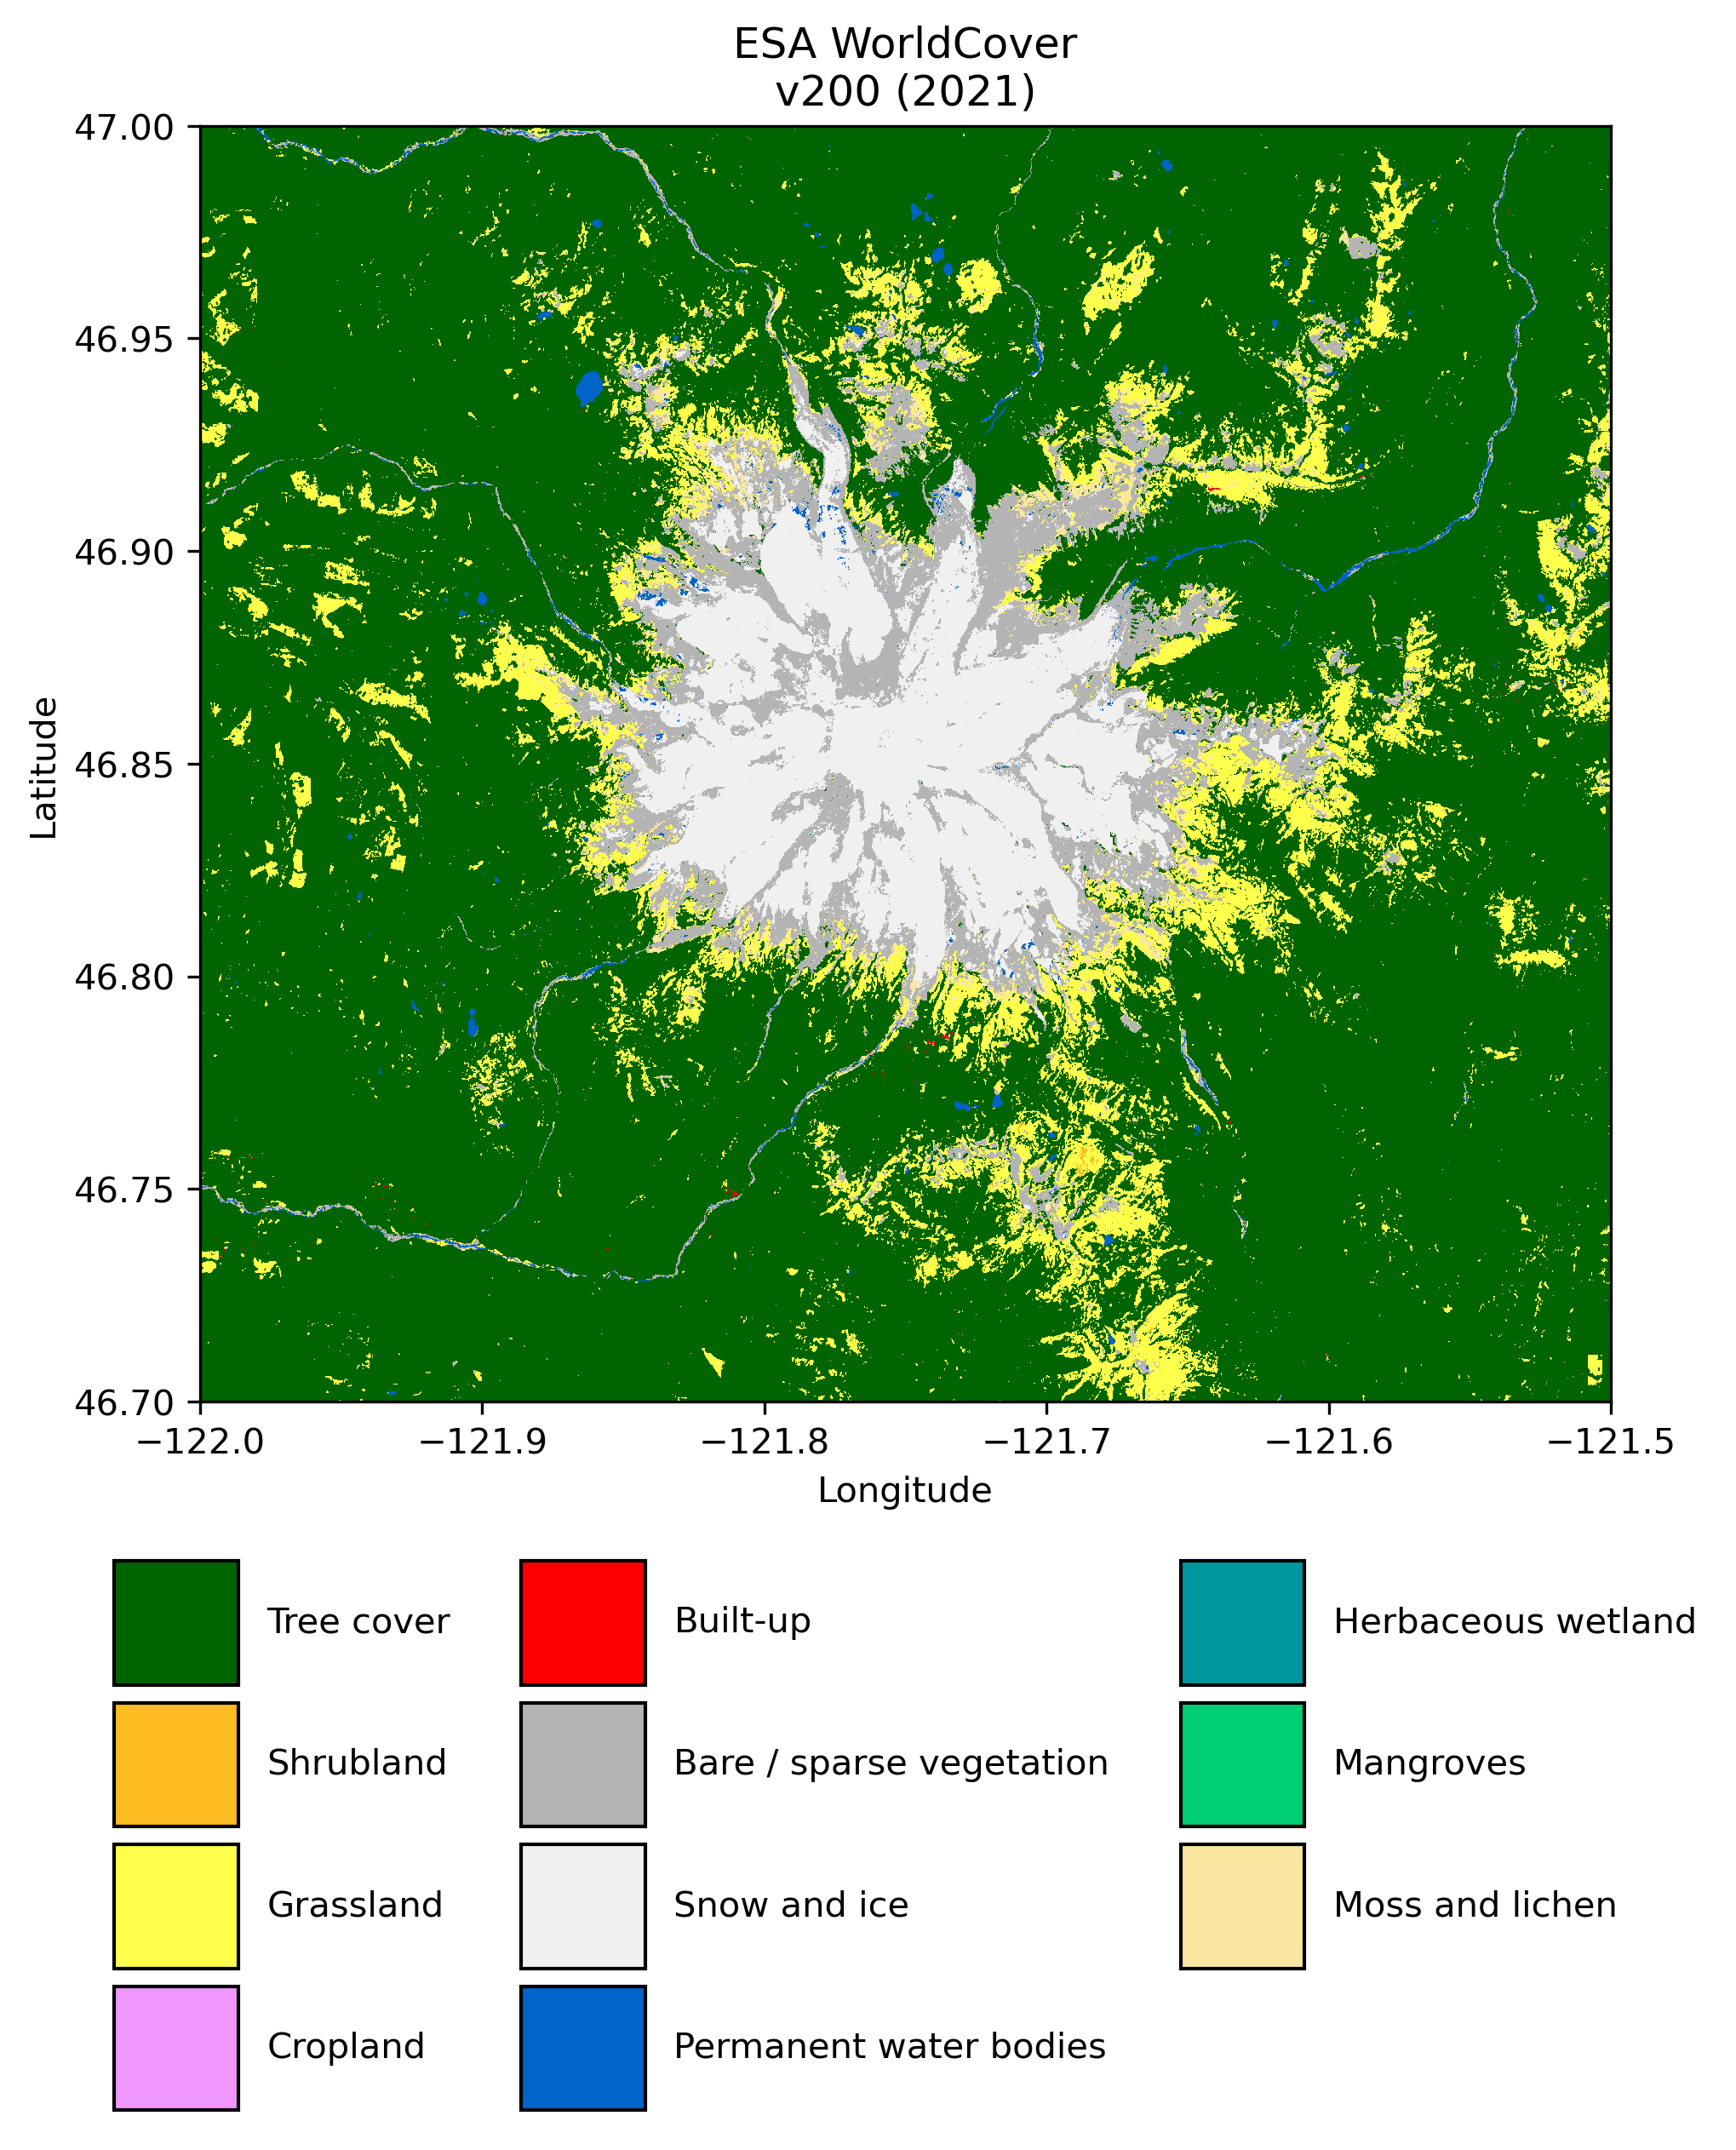
s2 = easysnowdata.remote_sensing.Sentinel2(
    bbox_input=bbox,
    start_date="2022-07-21",
    end_date="2022-07-31",
    resolution=80,
)
#s2.data
Data searched. Access the returned seach with the .search attribute.
Data retrieved. Access with the .data attribute. Data CRS: WGS 84 / UTM zone 10N.
Nodata values removed from the data. In doing so, all bands converted to float32. To turn this behavior off, set remove_nodata=False.
Data acquired after January 25th, 2022 harmonized to old baseline. To override this behavior, set harmonize_to_old=False.
Data scaled to float reflectance. To turn this behavior off, set scale_data=False.
Metadata retrieved. Access with the .metadata attribute.
s2.get_rgb()
RGB data retrieved.
Access with the following attributes:
.rgb for raw RGB,
.rgba for RGBA,
.rgb_percentile for percentile RGB,
.rgb_clahe for CLAHE RGB.
You can pass in percentile_kwargs and clahe_kwargs to adjust RGB calculations, check documentation for options.
s2.rgb_clahe.plot.imshow(col='time',col_wrap=3)
/home/eric/miniconda3/envs/easysnowdata/lib/python3.10/site-packages/rasterio/warp.py:344: NotGeoreferencedWarning: Dataset has no geotransform, gcps, or rpcs. The identity matrix will be returned.
  _reproject(
<xarray.plot.facetgrid.FacetGrid at 0x7f68575bdd50>